In this article, we will compare the Gross Domestic Product (GDP) of the Group of Twenty (G20) nations for the 20-year period from 2004 to 2023. We will see which nations have done better than the others during the last 10 years, since the global recession in 2008. We will also look at the International Monetary Fund (IMF) forecast for the G20 countries from 2019 to 2023.
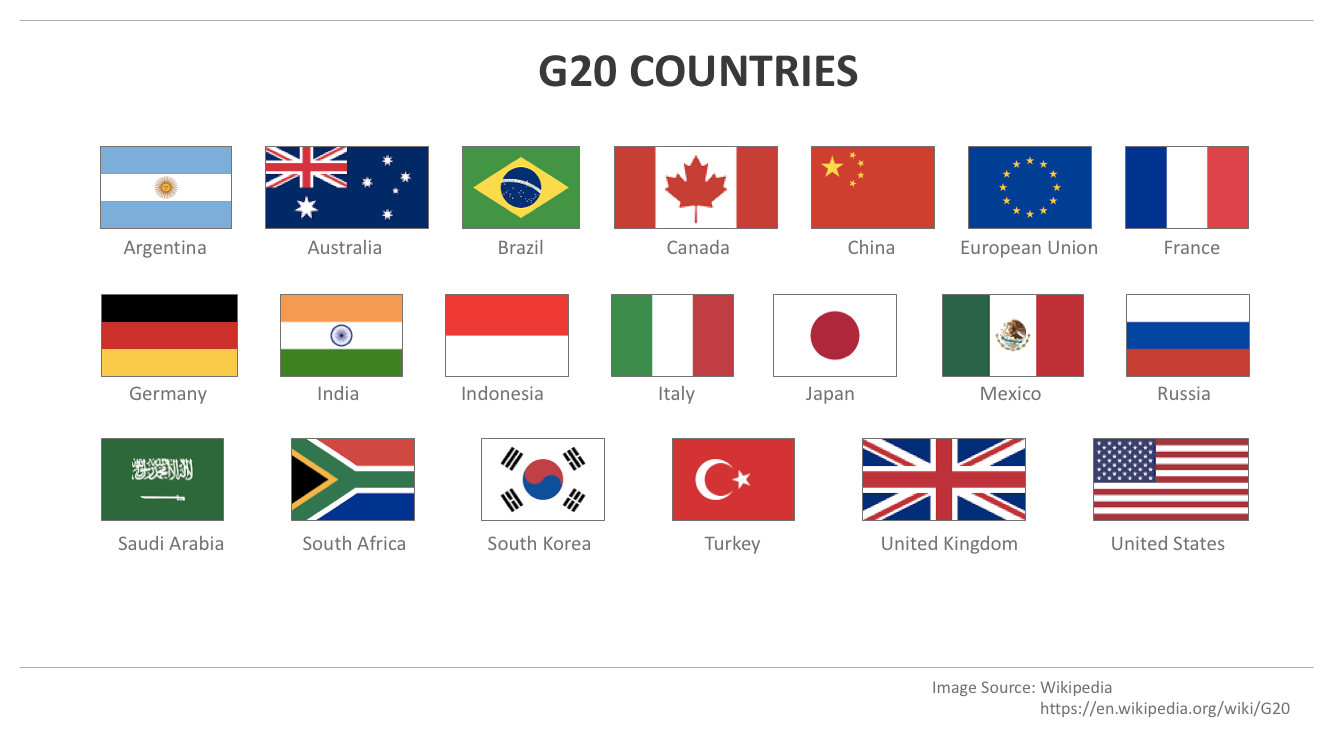
About G20
The Group of Twenty (G20) is a leading forum of the world’s major economies that seeks to develop policies to address the global challenges. The G20 is made up of 19 countries and the European Union (EU). Collectively, G20 members represent all inhabited continents, 85% of global economic output, two-thirds of the world’s population and 75% of international trade. The list of G20 countries by the continent is as follows:
- North America - Canada, Mexico, The United States (US)
- South America - Argentina, Brazil
- Europe - France, Germany, Italy, Russia, The European Union (EU), The United Kingdom (UK)
- Asia - China, India, Indonesia, Japan, Saudi Arabia, South Korea, Turkey
- Africa - South Africa
- Oceania - Australia
G20 Countries GDP and GDP Per Capita - 2019 Forecast
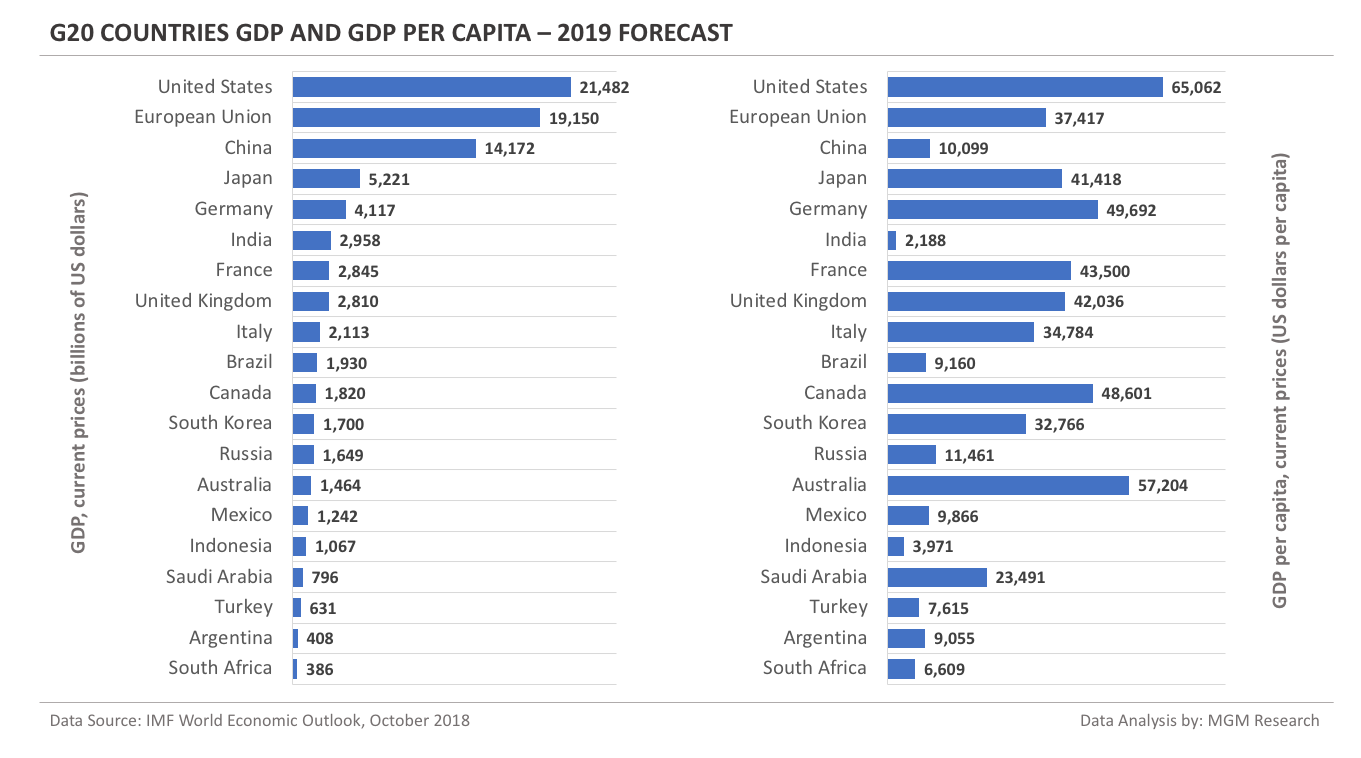
We will start with a GDP and GDP per capita forecast for the current year (2019) for the G20 nations. The US tops the list both in GDP and GDP per capita. In 2019, IMF forecasts the US GDP to reach $21,482 billion and the US GDP per capita to reach $65,062. The following charts shows the GDP and GDP per capita of the G20 countries for the year 2019.
The United States GDP 2004-2023
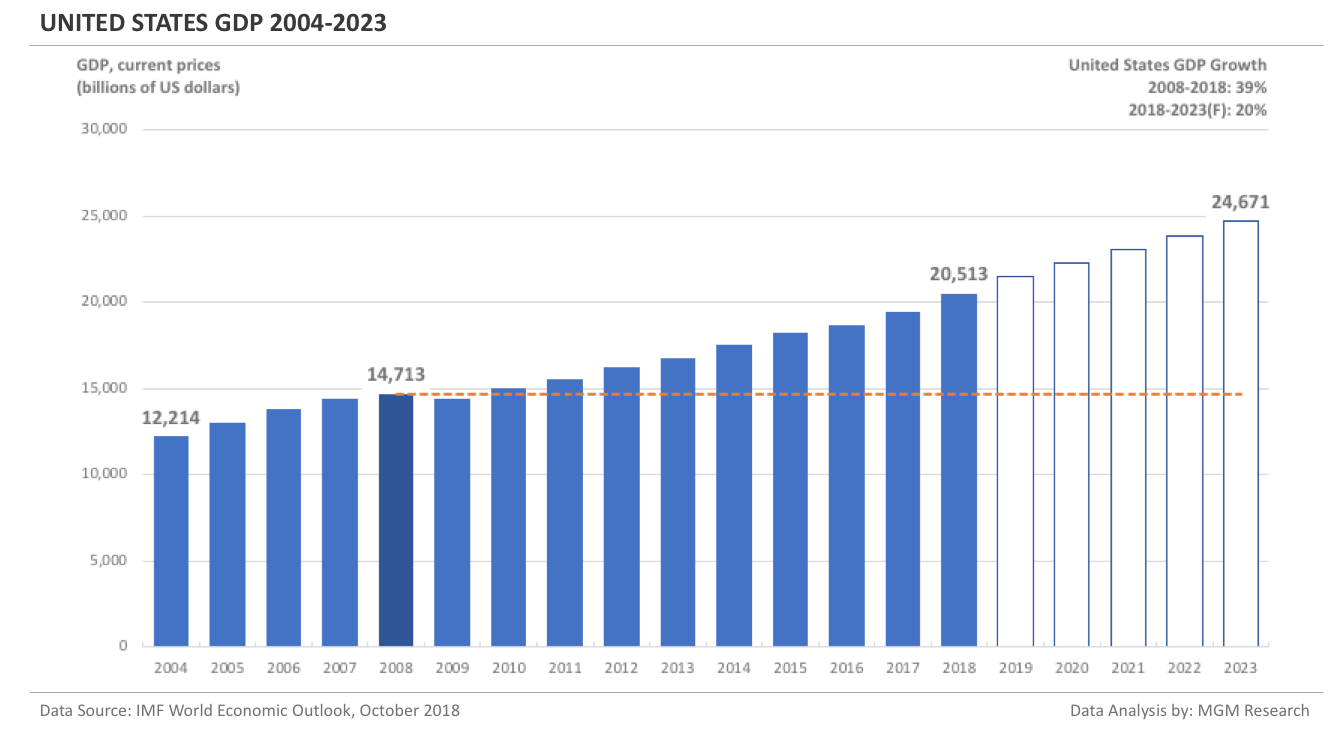
The US GDP in 2008 was $14,713 billion. IMF estimates the US GDP to be $20,513 billion in 2018. This implies an increase of 39% in the US GDP in 10 years, from 2008 to 2018.
IMF forecasts the US GDP will reach $24,671 billion in 2023. So, in 5 years, from 2018 to 2023, IMF forecasts the US GDP to increase by 20%.
In 2019, IMF forecasts the US GDP to reach $21,482 billion. The following chart shows the GDP of the US from 2004 to 2023.
The European Union GDP 2004-2023
The European Union (EU) is a political and economic union of 28 countries in the Europe continent. For a detailed analysis comparing European Union (and its countries) with the United States, please refer to our previous article ‘US vs EU: A GDP Comparison’.
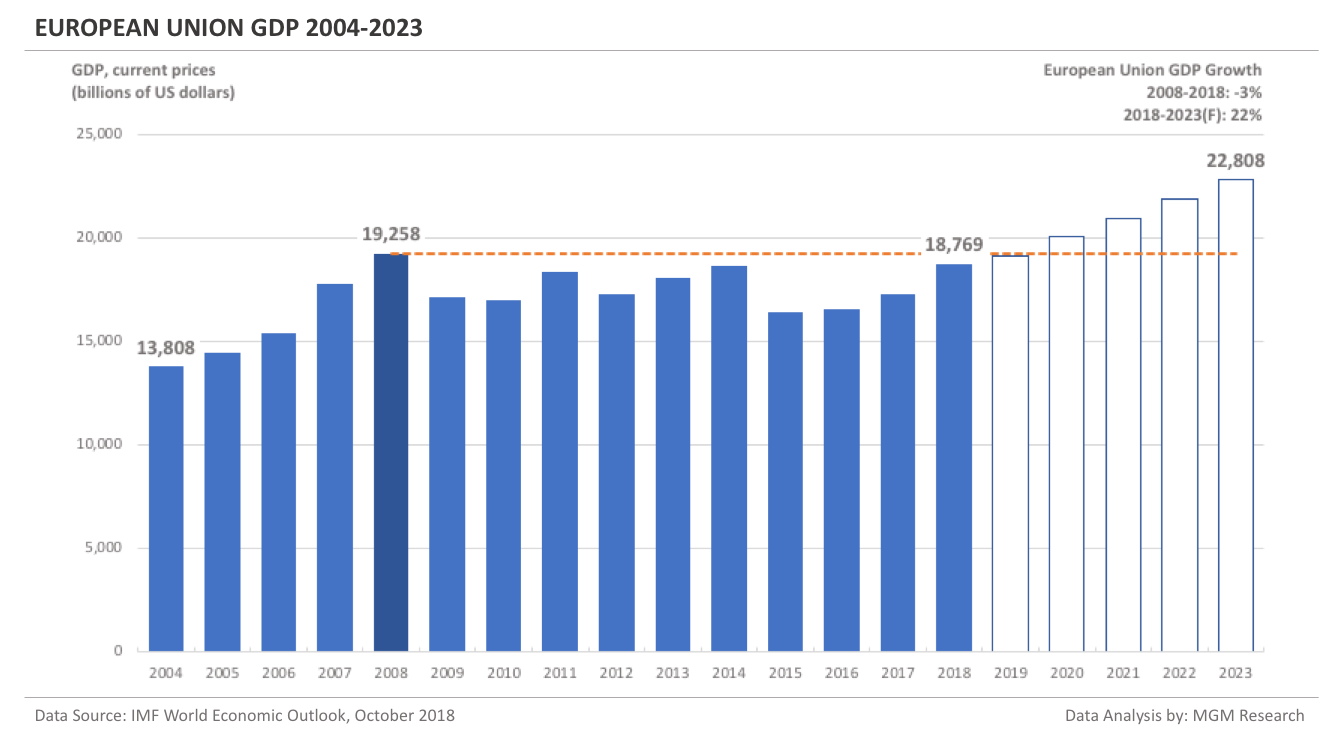
The EU GDP in 2008 was $19,258 billion. IMF estimates the EU GDP to be $18,769 billion in 2018. This implies a decrease of -3% in the EU GDP in 10 years, from 2008 to 2018.
IMF forecasts the EU GDP will reach $22,808 billion in 2023. So, in 5 years, from 2018 to 2023, IMF forecasts the EU GDP to increase by 22%.
In the event of Brexit, the EU GDP will be revised downwards for 2019 to 2023.
In 2019, IMF forecasts the EU GDP to reach $19,150 billion. The following chart shows the GDP of the EU from 2004 to 2023.
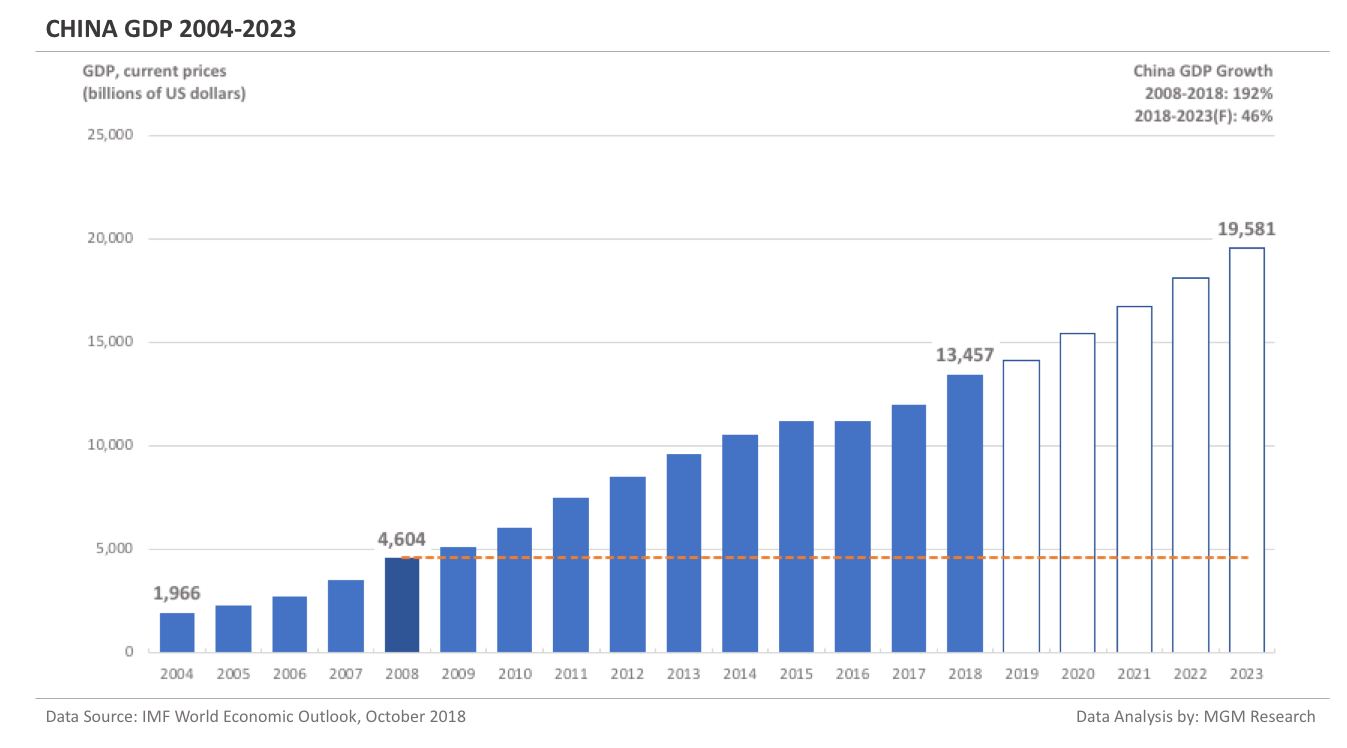
China GDP 2004-2023
In 2004, China was ranked sixth in nominal GDP terms. China was behind the US, Japan, Germany, the UK, and France. By 2008, China was only behind the US and Japan. China is now the second largest economy in the world, just behind the US. For a detailed analysis comparing China with the United States, please refer to our previous article ‘China vs US: A GDP Comparison’.
China GDP in 2008 was $4,604 billion. IMF estimates China GDP to be $13,457 billion in 2018. This implies an increase of 192% in China GDP in 10 years, from 2008 to 2018.
IMF forecasts China GDP will reach $19,581 billion in 2023. So, in 5 years, from 2018 to 2023, IMF forecasts China GDP to increase by 46%.
In 2019, IMF forecasts China GDP to reach $14,172 billion. The following chart shows the GDP of China from 2004 to 2023.
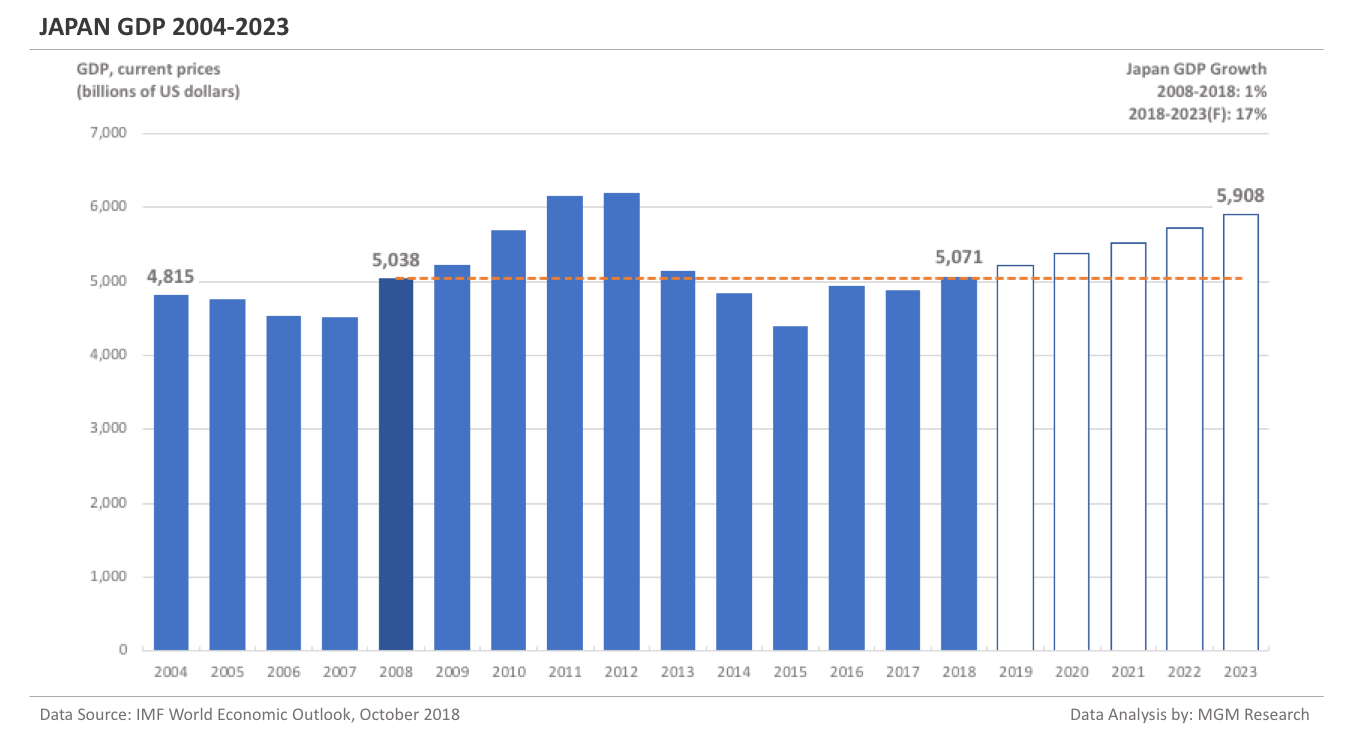
Japan GDP 2004-2023
Japan is currently the third-largest economy in the world and is likely to remain so during the forecast period.
Japan GDP in 2008 was $5,038 billion. IMF estimates Japan GDP to be $5,071 billion in 2018. This implies an increase of less than 1% in Japan GDP in 10 years, from 2008 to 2018.
IMF forecasts Japan GDP will reach $5,908 billion in 2023. So, in 5 years, from 2018 to 2023, IMF forecasts Japan GDP to increase by 17%.
In 2019, IMF forecasts Japan GDP to reach $5,221 billion. The following chart shows the GDP of Japan from 2004 to 2023. The following chart shows the GDP of Japan from 2004 to 2023.
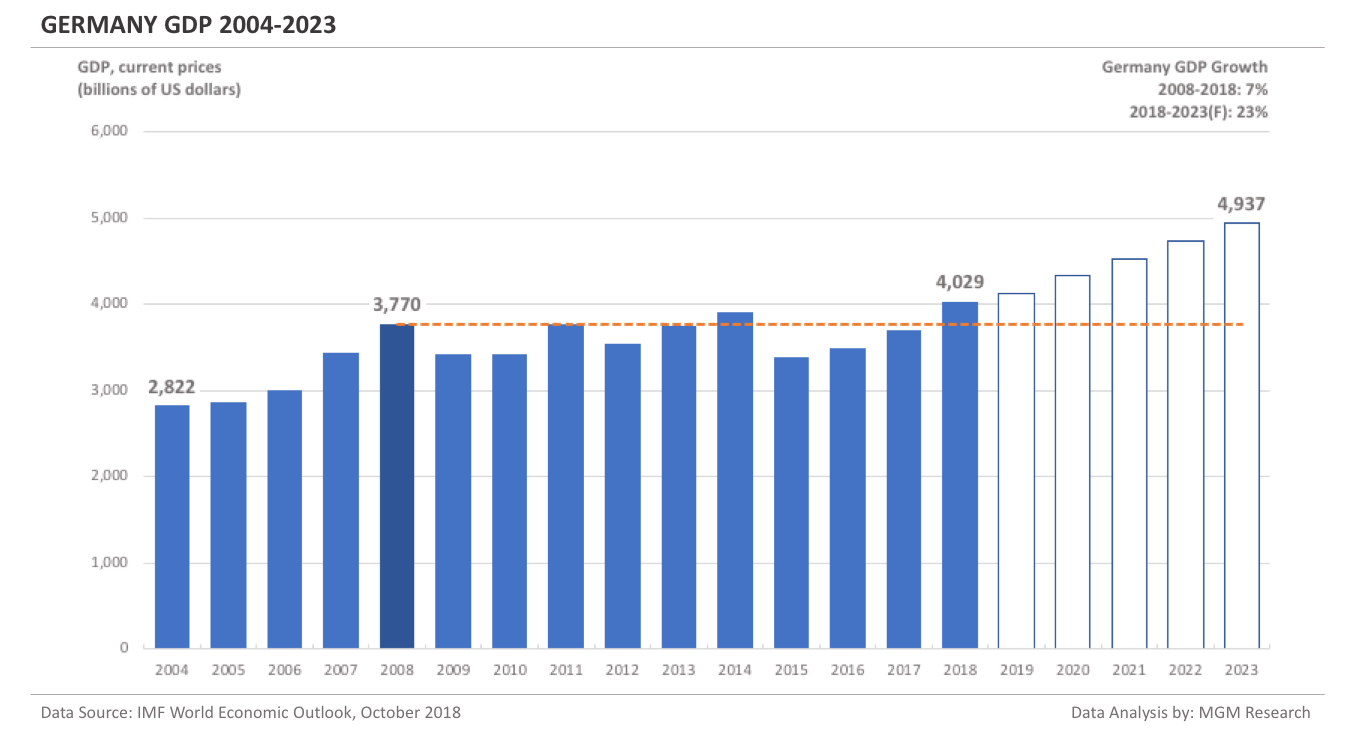
Germany GDP 2004-2023
Germany is currently the fourth-largest economy in the world and is likely to remain so during the forecast period.
Germany GDP in 2008 was $3,770 billion. IMF estimates Germany GDP to be $4,029 billion in 2018. This implies an increase of 7% in Germany GDP in 10 years, from 2008 to 2018.
IMF forecasts Germany GDP will reach $4,937 billion in 2023. So, in 5 years, from 2018 to 2023, IMF forecasts Germany GDP to increase by 23%.
In 2019, IMF forecasts Germany GDP to reach $4,117 billion. The following chart shows the GDP of Germany from 2004 to 2023. The following chart shows the GDP of Germany from 2004 to 2023.
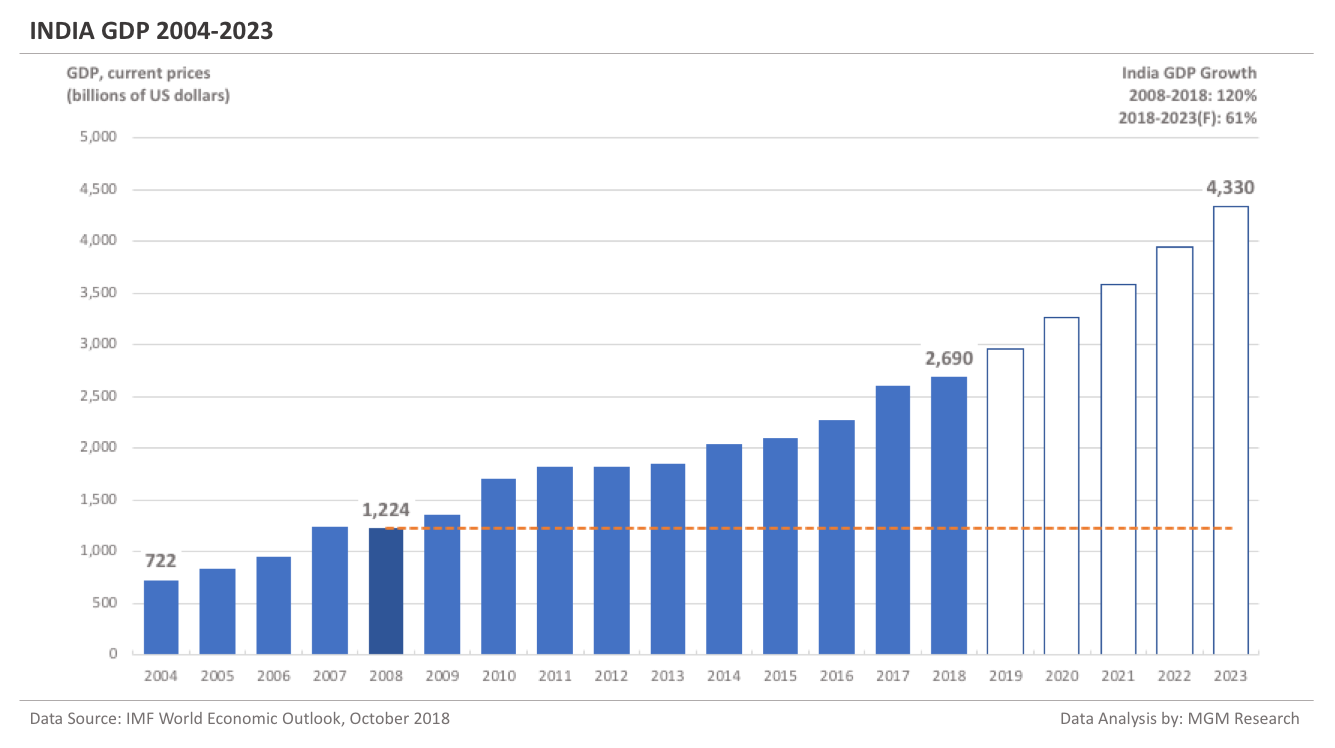
India GDP 2004-2023
In 2008, India was ranked twelfth. India was behind the US, Japan, China, Germany, the UK, France, Italy, Russia, Brazil, Spain, and Canada. In 2019, IMF forecasts India to become the fifth largest economy behind the US, China, Japan, and Germany. IMF forecasts that India will overtake France and the UK in GDP during 2019. However, in GDP per capita terms, India ranks the lowest among the G20 nations. Improving GDP per capita ranking will be extremely challenging for India.
India GDP in 2008 was $1,224 billion. IMF estimates India GDP to be $2,690 billion in 2018. This implies an increase of 120% in India GDP in 10 years, from 2008 to 2018.
IMF forecasts India GDP will reach $4,330 billion in 2023. So, in 5 years, from 2018 to 2023, IMF forecasts India GDP to increase by 61%.
In 2019, IMF forecasts India GDP to reach $2,958 billion. The following chart shows the GDP of India from 2004 to 2023.
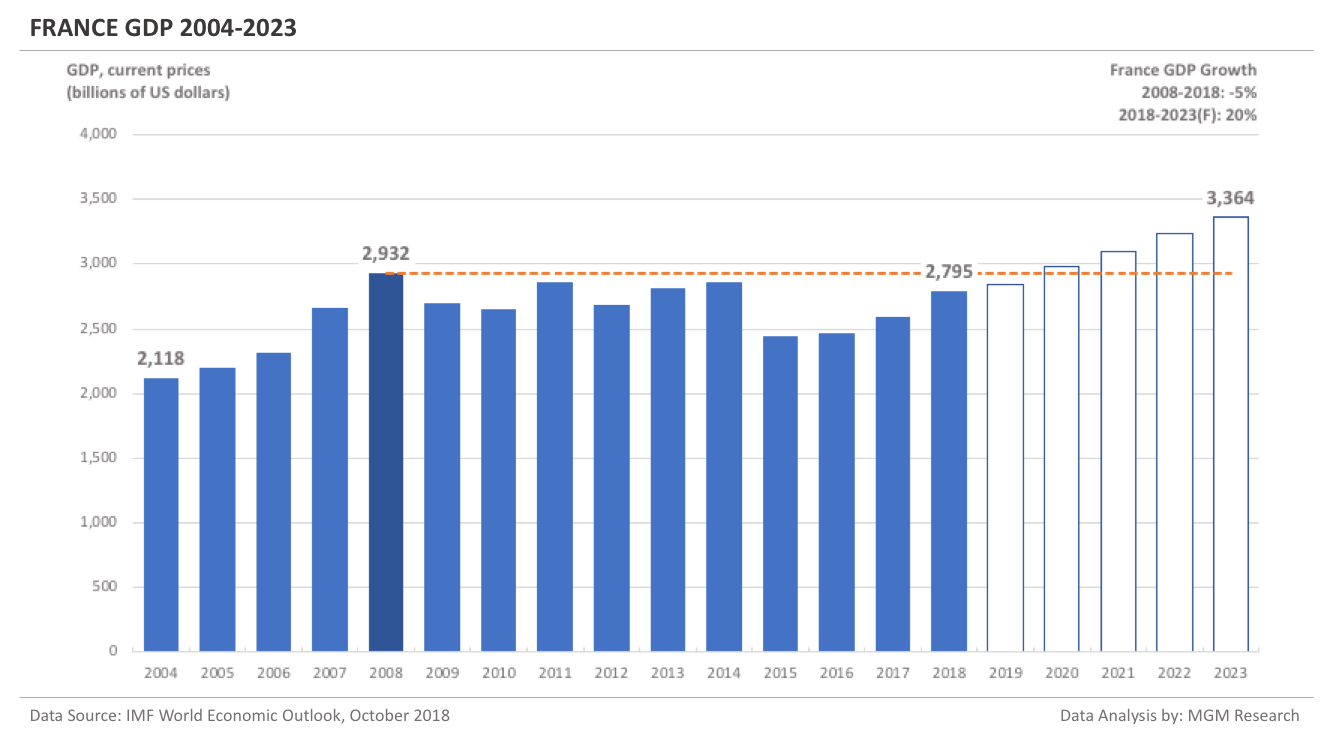
France GDP 2004-2023
France GDP in 2008 was $2,932 billion. IMF estimates France GDP to be $2,795 billion in 2018. This implies a decrease of -5% in France GDP in 10 years, from 2008 to 2018.
IMF forecasts France GDP will reach $3,364 billion in 2023. So, in 5 years, from 2018 to 2023, IMF forecasts France GDP to increase by 20%.
In 2019, IMF forecasts France GDP to reach $2,845 billion. The following chart shows the GDP of France from 2004 to 2023.
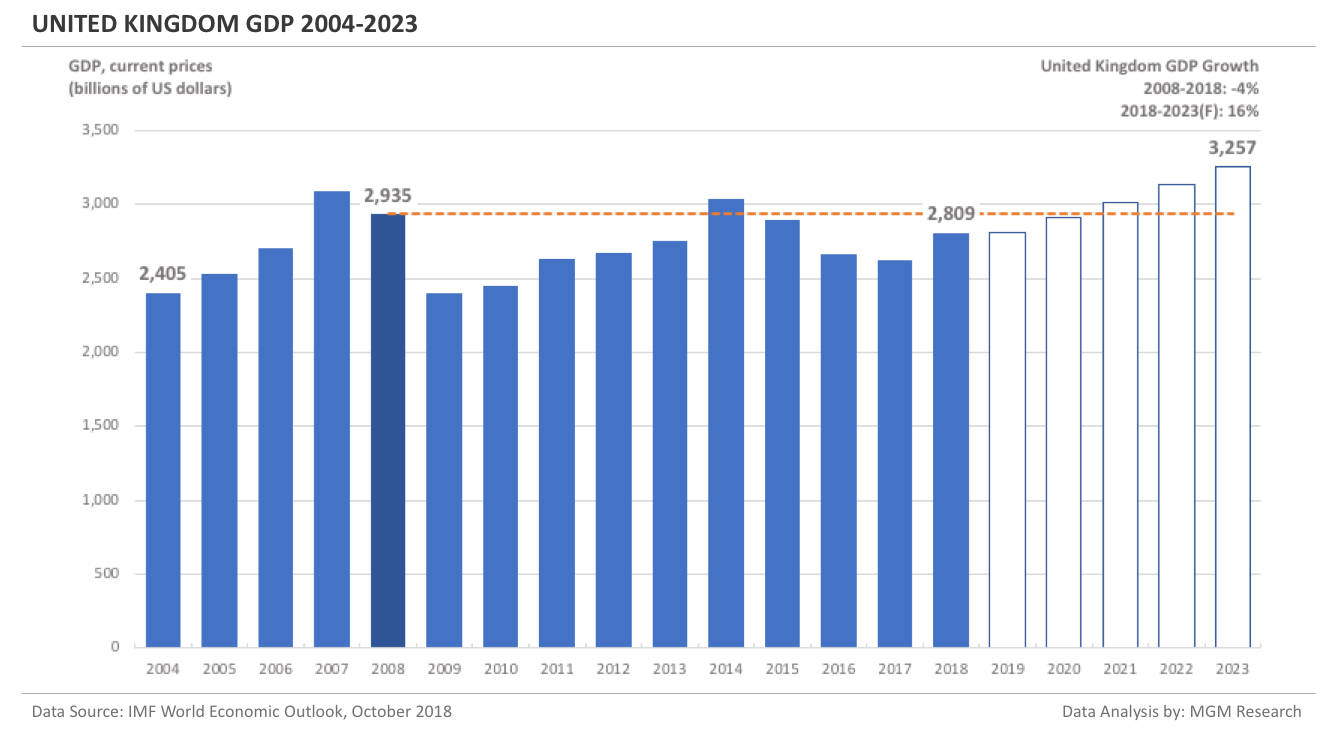
United Kingdom GDP 2004-2023
The UK GDP in 2008 was $2,935 billion. IMF estimates the UK GDP to be $2,809 billion in 2018. This implies a decrease of -4% in the UK GDP in 10 years, from 2008 to 2018.
IMF forecasts the UK GDP will reach $3,257 billion in 2023. So, in 5 years, from 2018 to 2023, IMF forecasts the UK GDP to increase by 16%.
In 2019, IMF forecasts the UK GDP to reach $2,810 billion. The following chart shows the GDP of the UK from 2004 to 2023.
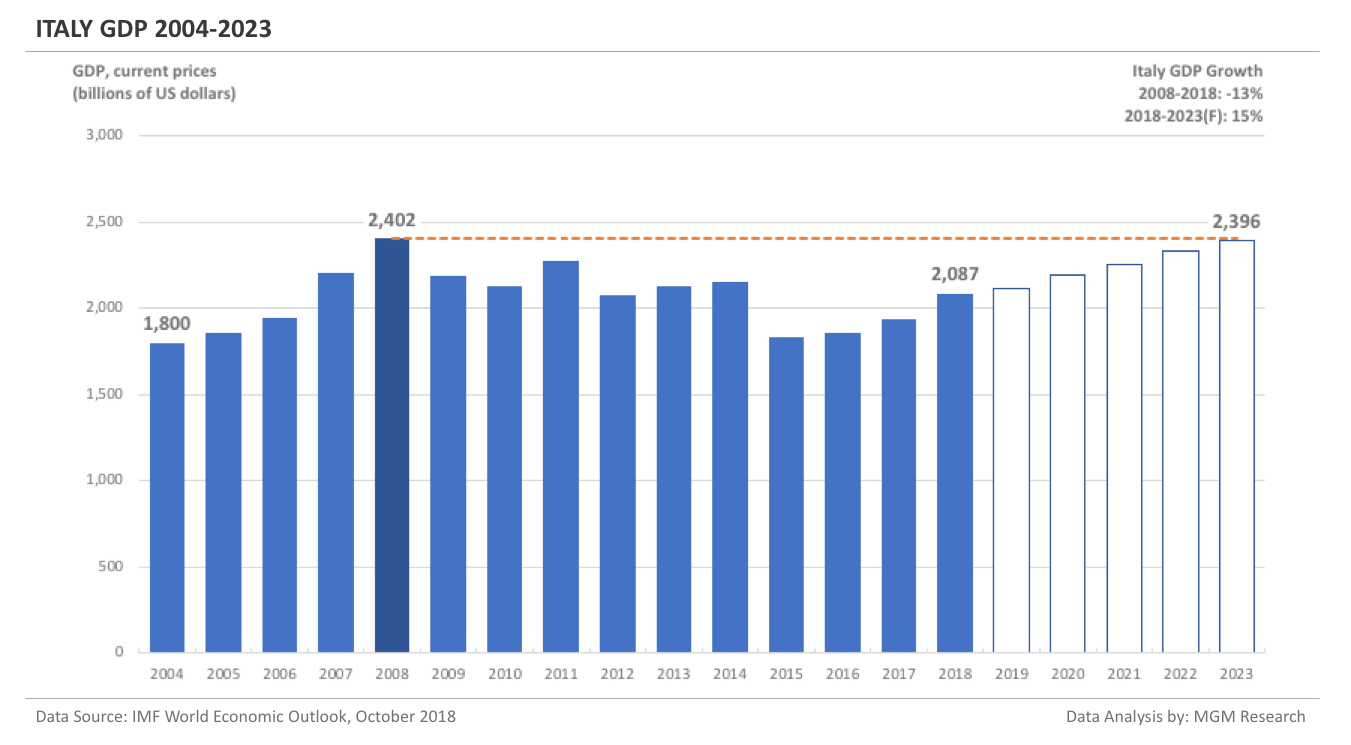
Italy GDP 2004-2023
Italy GDP in 2008 was $2,402 billion. IMF estimates Italy GDP to be $2,087 billion in 2018. This implies a decrease of -13% in Italy GDP in 10 years, from 2008 to 2018.
IMF forecasts Italy GDP will reach $2,396 billion in 2023. So, in 5 years, from 2018 to 2023, IMF forecasts Italy GDP to increase by 15%.
In 2019, IMF forecasts Italy GDP to reach $2,113 billion. The following chart shows the GDP of Italy from 2004 to 2023.
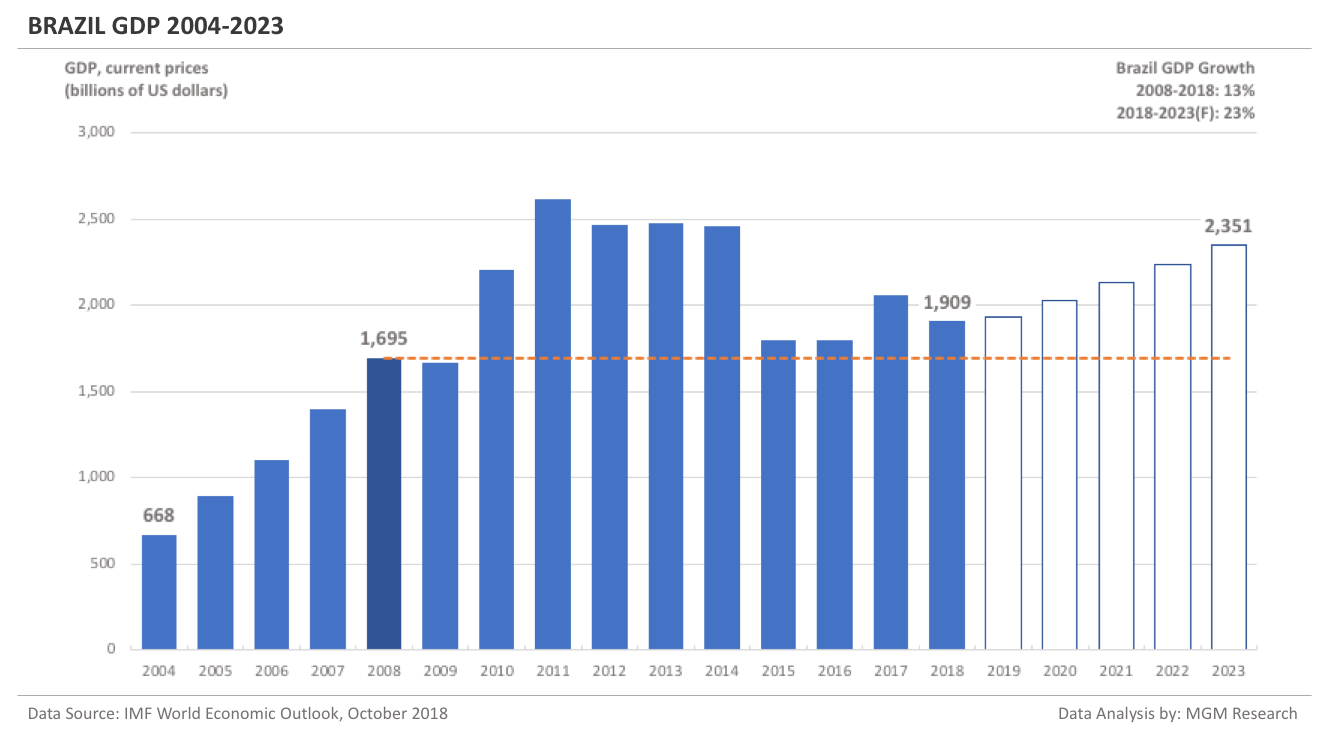
Brazil GDP 2004-2023
Brazil GDP in 2008 was $1,695 billion. IMF estimates Brazil GDP to be $1,909 billion in 2018. This implies an increase of 13% in Brazil GDP in 10 years, from 2008 to 2018.
IMF forecasts Brazil GDP will reach $2,351 billion in 2023. So, in 5 years, from 2018 to 2023, IMF forecasts Brazil GDP to increase by 23%.
In 2019, IMF forecasts Brazil GDP to reach $1,930 billion. The following chart shows the GDP of Brazil from 2004 to 2023.
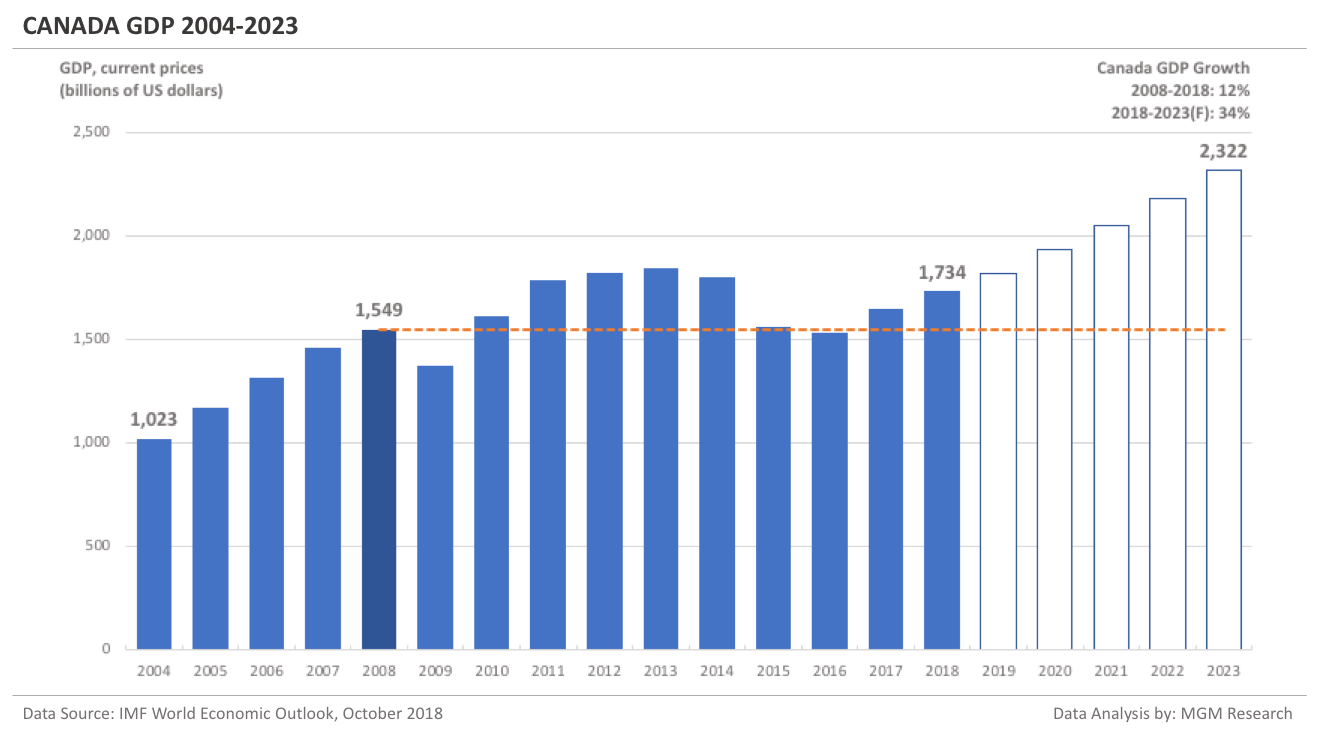
Canada GDP 2004-2023
Canada GDP in 2008 was $1,549 billion. IMF estimates Canada GDP to be $1,734 billion in 2018. This implies an increase of 12% in Canada GDP in 10 years, from 2008 to 2018.
IMF forecasts Canada GDP will reach $2,322 billion in 2023. So, in 5 years, from 2018 to 2023, IMF forecasts Canada GDP to increase by 34%.
In 2019, IMF forecasts Canada GDP to reach $1,820 billion. The following chart shows the GDP of Canada from 2004 to 2023.
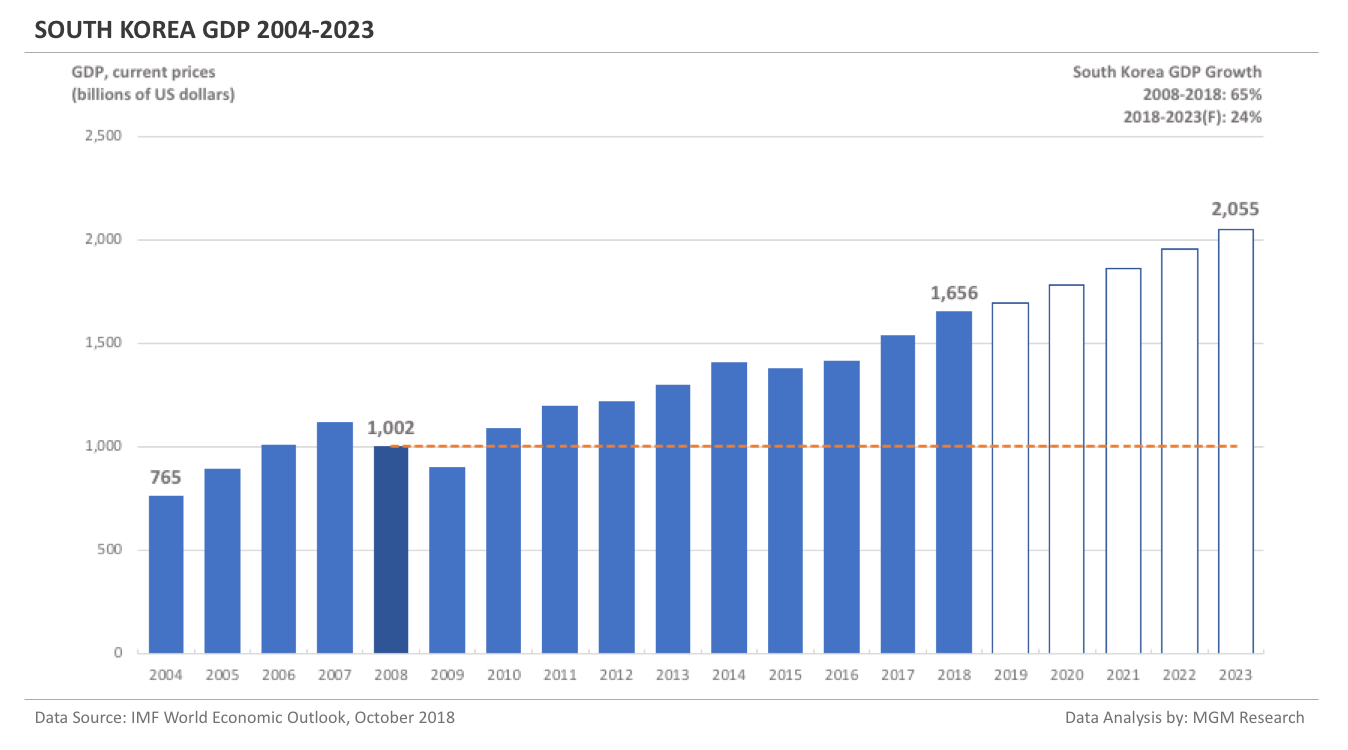
South Korea GDP 2004-2023
South Korea GDP in 2008 was $1,002 billion. IMF estimates South Korea GDP to be $1,656 billion in 2018. This implies an increase of 65% in South Korea GDP in 10 years, from 2008 to 2018.
IMF forecasts South Korea GDP will reach $2,055 billion in 2023. So, in 5 years, from 2018 to 2023, IMF forecasts South Korea GDP to increase by 24%.
In 2019, IMF forecasts South Korea GDP to reach $1,700 billion.The following chart shows the GDP of South Korea from 2004 to 2023.
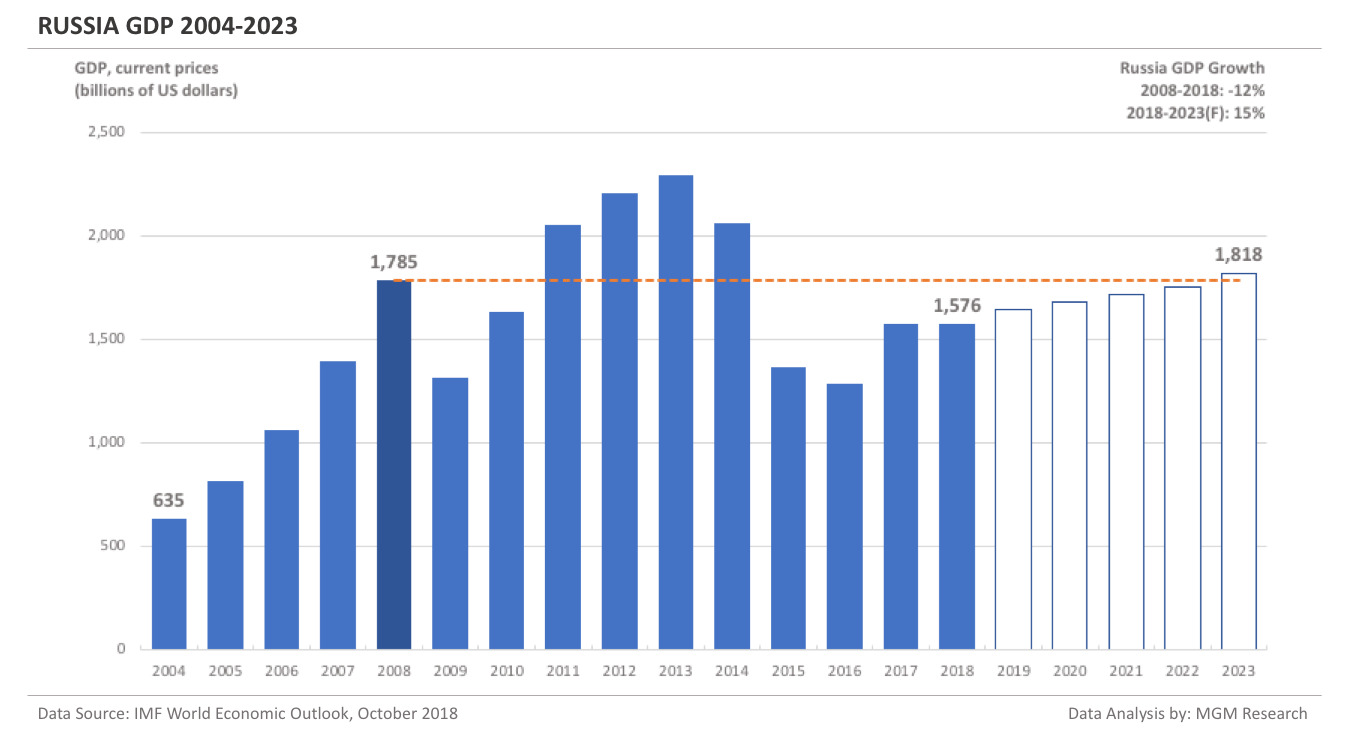
Russia GDP 2004-2023
Russia GDP in 2008 was $1,785 billion. IMF estimates Russia GDP to be $1,576 billion in 2018. This implies a decrease of -12% in Russia GDP in 10 years, from 2008 to 2018.
IMF forecasts Russia GDP will reach $1,818 billion in 2023. So, in 5 years, from 2018 to 2023, IMF forecasts Russia GDP to increase by 15%.
In 2019, IMF forecasts Russia GDP to reach $1,649 billion.The following chart shows the GDP of Russia from 2004 to 2023.
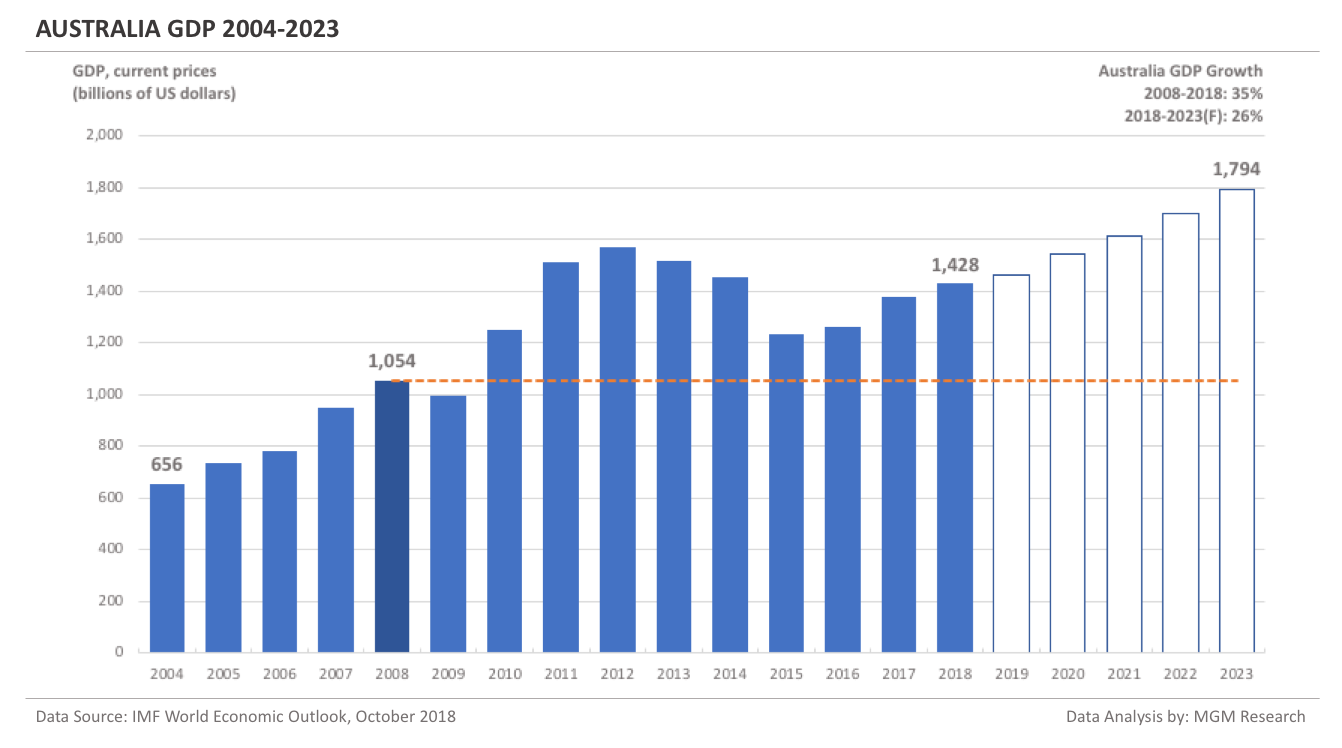
Australia GDP 2004-2023
Australia GDP in 2008 was $1,054 billion. IMF estimates Australia GDP to be $1,428 billion in 2018. This implies an increase of 35% in Australia GDP in 10 years, from 2008 to 2018.
IMF forecasts Australia GDP will reach $1,794 billion in 2023. So, in 5 years, from 2018 to 2023, IMF forecasts Australia GDP to increase by 26%.
In 2019, IMF forecasts Australia GDP to reach $1,464 billion.The following chart shows the GDP of Australia from 2004 to 2023.
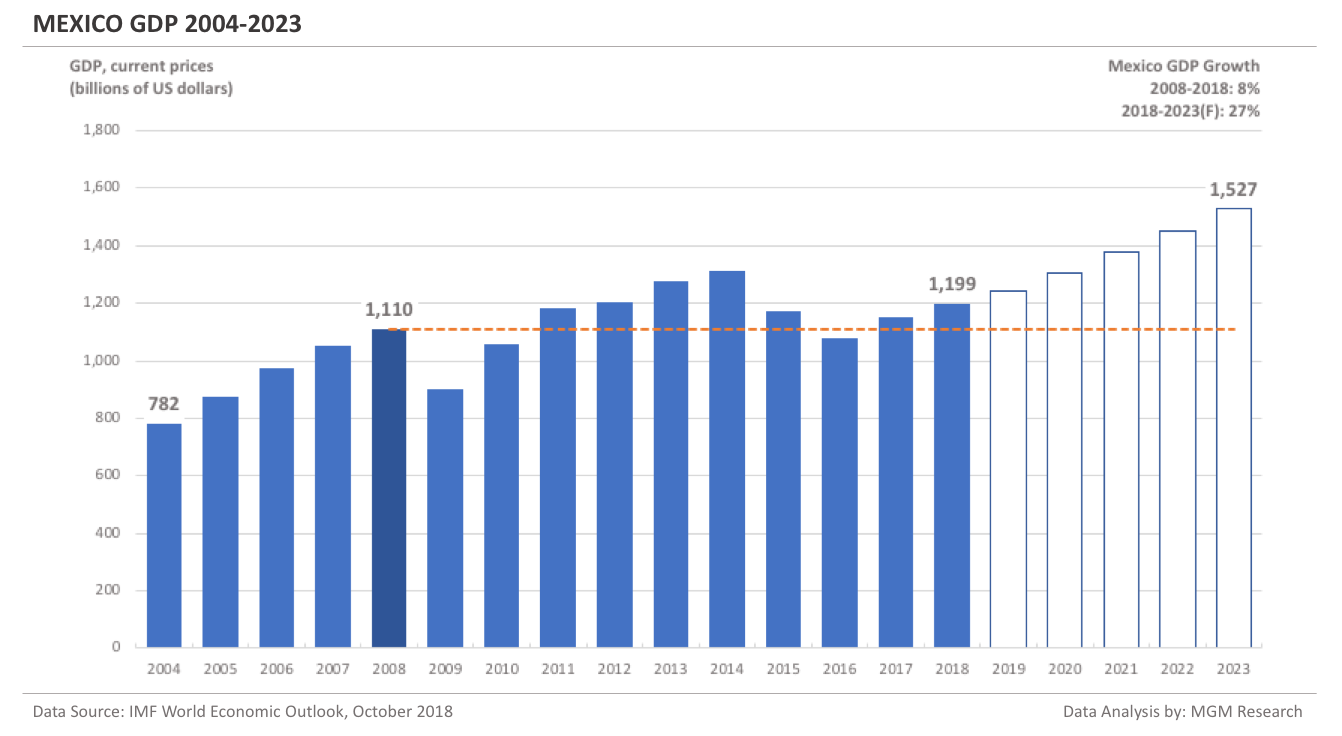
Mexico GDP 2004-2023
Mexico GDP in 2008 was $1,110 billion. IMF estimates Mexico GDP to be $1,199 billion in 2018. This implies an increase of 8% in Mexico GDP in 10 years, from 2008 to 2018.
IMF forecasts Mexico GDP will reach $1,527 billion in 2023. So, in 5 years, from 2018 to 2023, IMF forecasts Mexico GDP to increase by 27%.
In 2019, IMF forecasts Mexico GDP to reach $1,242 billion.The following chart shows the GDP of Mexico from 2004 to 2023.
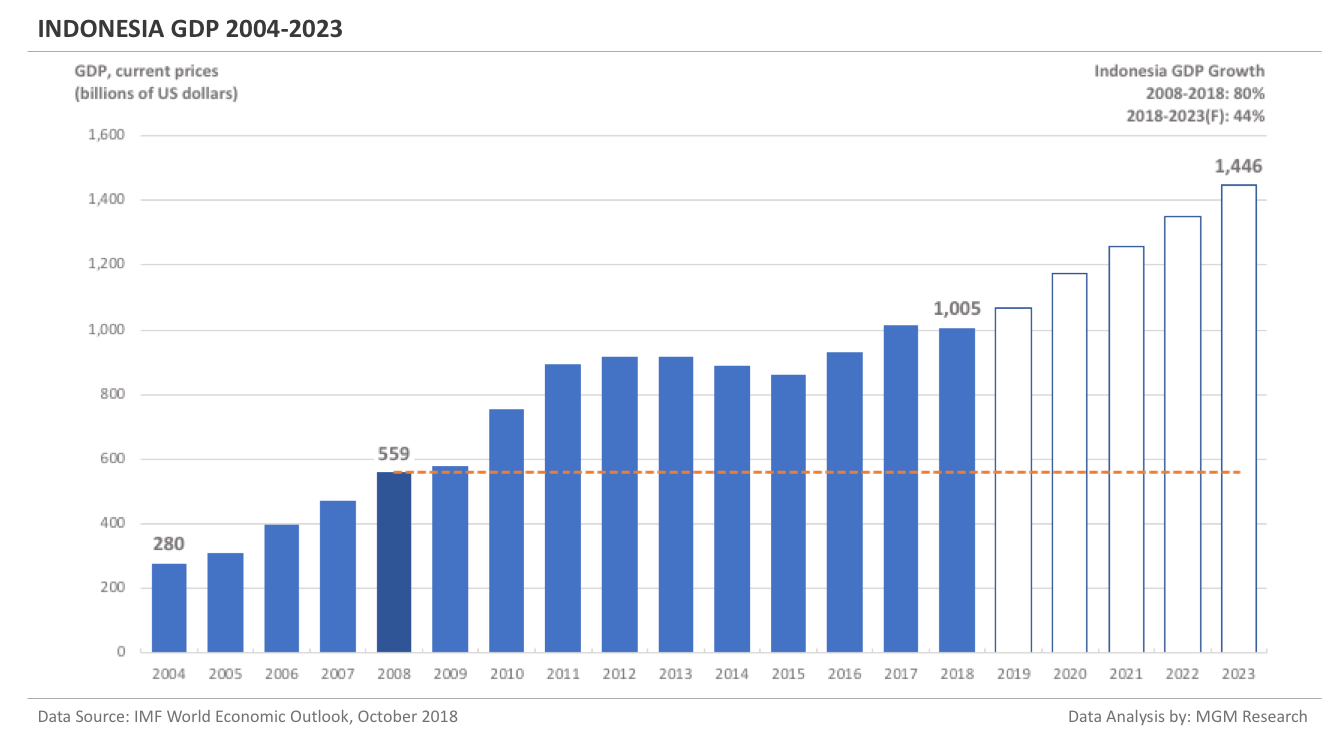
Indonesia GDP 2004-2023
Indonesia GDP in 2008 was $559 billion. IMF estimates Indonesia GDP to be $1,005 billion in 2018. This implies an increase of 80% in Indonesia GDP in 10 years, from 2008 to 2018.
IMF forecasts Indonesia GDP will reach $1,446 billion in 2023. So, in 5 years, from 2018 to 2023, IMF forecasts Indonesia GDP to increase by 44%.
In 2019, IMF forecasts Indonesia GDP to reach $1,067 billion.The following chart shows the GDP of Indonesia from 2004 to 2023.
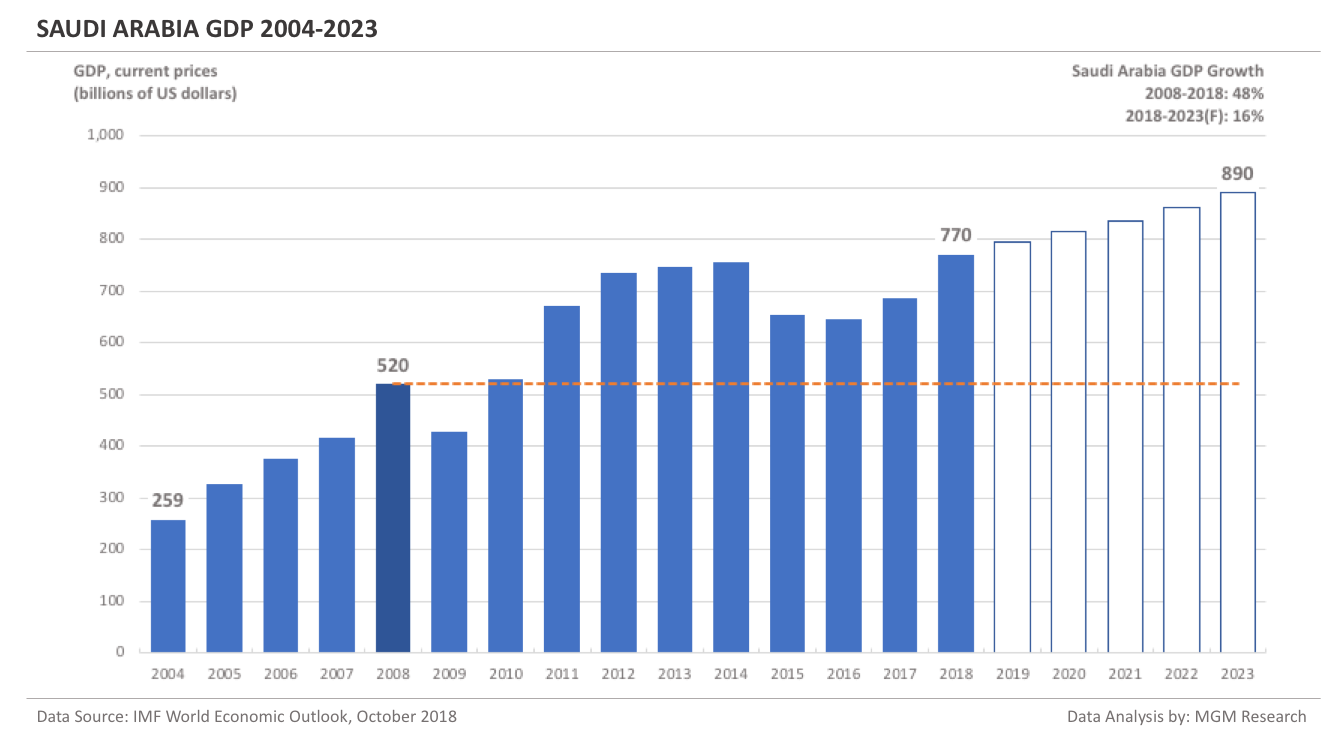
Saudi Arabia GDP 2004-2023
Saudi Arabia GDP in 2008 was $520 billion. IMF estimates Saudi Arabia GDP to be $770 billion in 2018. This implies an increase of 48% in Saudi Arabia GDP in 10 years, from 2008 to 2018.
IMF forecasts Saudi Arabia GDP will reach $890 billion in 2023. So, in 5 years, from 2018 to 2023, IMF forecasts Saudi Arabia GDP to increase by 16%.
In 2019, IMF forecasts Saudi Arabia GDP to reach $796 billion.The following chart shows the GDP of Saudi Arabia from 2004 to 2023.
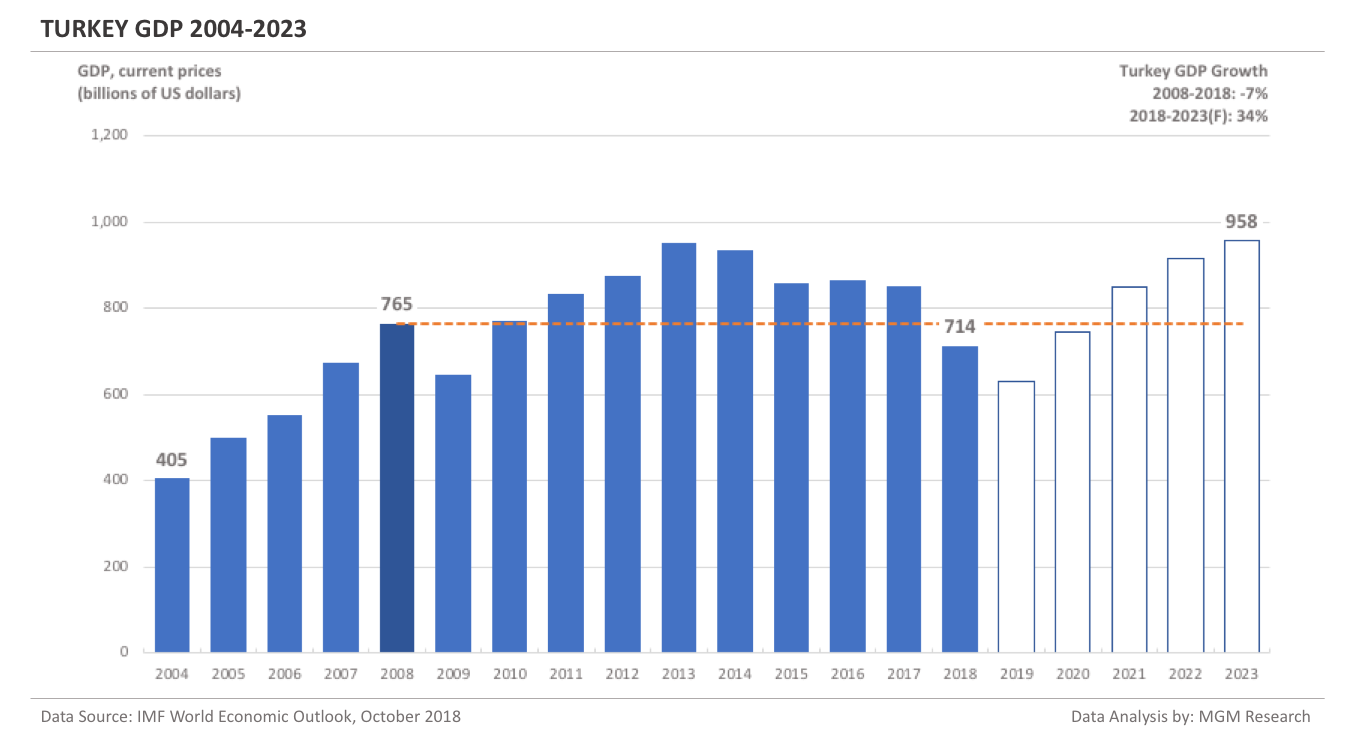
Turkey GDP 2004-2023
Turkey GDP in 2008 was $765 billion. IMF estimates Turkey GDP to be $714 billion in 2018. This implies a decrease of -7% in Turkey GDP in 10 years, from 2008 to 2018.
IMF forecasts Turkey GDP will reach $958 billion in 2023. So, in 5 years, from 2018 to 2023, IMF forecasts Turkey GDP to increase by 34%.
In 2019, IMF forecasts Turkey GDP to reach $631 billion.The following chart shows the GDP of Turkey from 2004 to 2023.
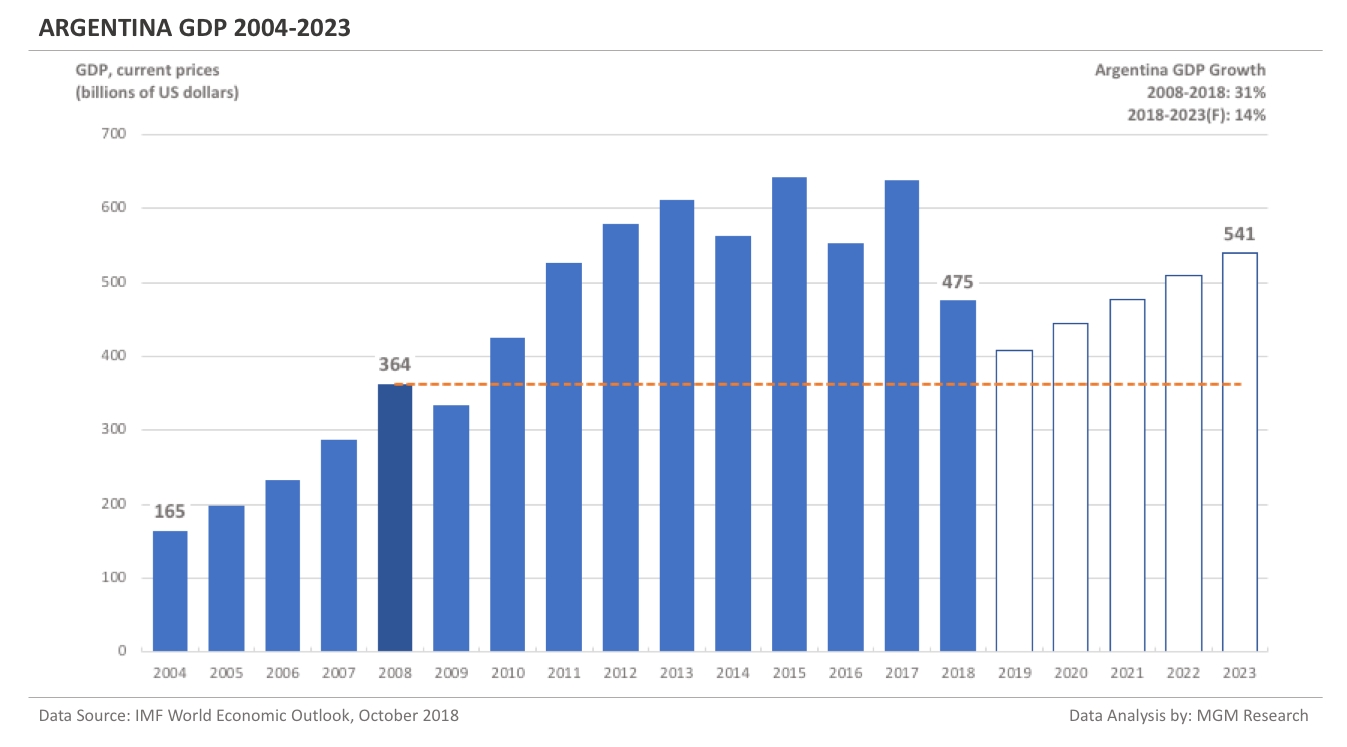
Argentina GDP 2004-2023
Argentina GDP in 2008 was $364 billion. IMF estimates Argentina GDP to be $475 billion in 2018. This implies an increase of 31% in Argentina GDP in 10 years, from 2008 to 2018.
IMF forecasts Argentina GDP will reach $541 billion in 2023. So, in 5 years, from 2018 to 2023, IMF forecasts Argentina GDP to increase by 14%.
In 2019, IMF forecasts Argentina GDP to reach $408 billion.The following chart shows the GDP of Argentina from 2004 to 2023.
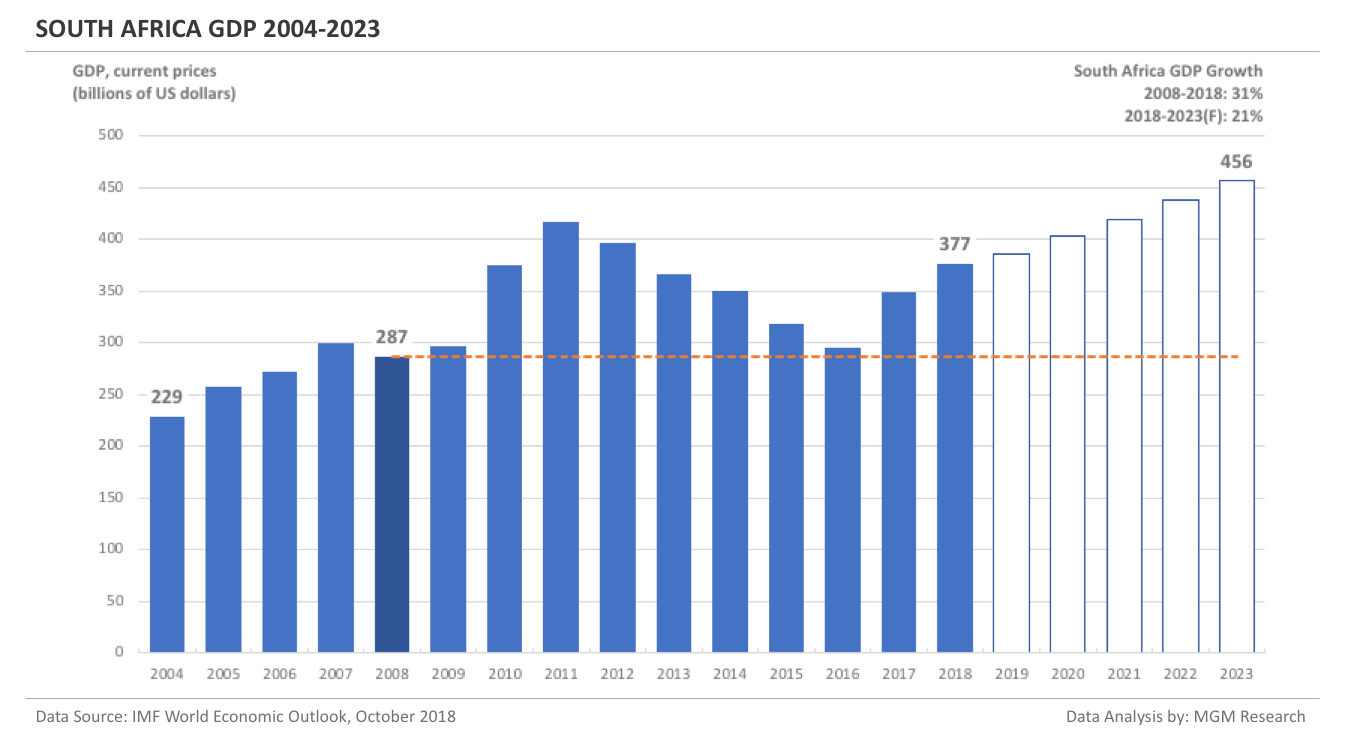
South Africa GDP 2004-2023
South Africa GDP in 2008 was $287 billion. IMF estimates South Africa GDP to be $377 billion in 2018. This implies an increase of 31% in South Africa GDP in 10 years, from 2008 to 2018.
IMF forecasts South Africa GDP will reach $456 billion in 2023. So, in 5 years, from 2018 to 2023, IMF forecasts South Africa GDP to increase by 21%.
In 2019, IMF forecasts South Africa GDP to reach $386 billion.The following chart shows the GDP of South Africa from 2004 to 2023.
Notes
About the IMF Forecasts. We are not sure about the IMF assumptions behind the forecasts for 2019 to 2023. For some countries, IMF forecast numbers look achievable. For some countries, the forecast numbers look very aggressive. In case of another global recession in the near future, IMF may revise its forecast numbers downwards. IMF updates its forecast numbers twice a year, in April and October. We have presented the latest available forecast numbers in this article.
About the 2018 estimates. For this article, we have used the numbers from IMF World Economic Outlook (WEO), October 2018. Even though 2018 numbers are IMF estimates for most of the countries, we believe they are likely to be achieved since the database was released in October 2018 only.
The Nominal GDP. In this article, we have presented the nominal GDP in US dollars. This helps in better comparison between the countries. Please note that the nominal GDP numbers are also influenced by the currency market exchange rates. For a comprehensive economic view of a single country, one should also look at the following: Real GDP in national currency, Real GDP growth, Nominal GDP in national currency, Nominal GDP on a Purchasing Parity Basis (PPP) in international dollars, and GDP per capita on a PPP basis in international dollars.
Related Articles
See Also
Wikipedia article on G20