In this article, we will share the ranking of 194 countries in the world based on their real GDP (Gross Domestic Product) growth during 2019. We have used the publicly available data from IMF (International Monetary Fund) to rank the countries. We have also provided an analysis based on whether the countries are developed or developing. IMF classifies these countries as ‘advanced economies’ and ’emerging market and developing economies’ respectively (Please see the notes at the bottom). Of the 194 countries, 39 countries classified as advanced economies and the remaining are classified as emerging market and developing economies.
This article is part of a series of articles ranking the countries in the world based on their GDP related indicators. In our other articles, we have provided world GDP rankings , world GDP per capita rankings , world GDP PPP (purchasing power parity) rankings , and world GDP PPP per capita rankings.
In this article, we will first provide the charts for the real GDP growth from 1980 to 2020 for the whole world, the advanced economies, and the developing economies. Then, we will present real GDP growth ranking of the countries grouped by regions. Then, we will provide real GDP growth ranking of all the countries.
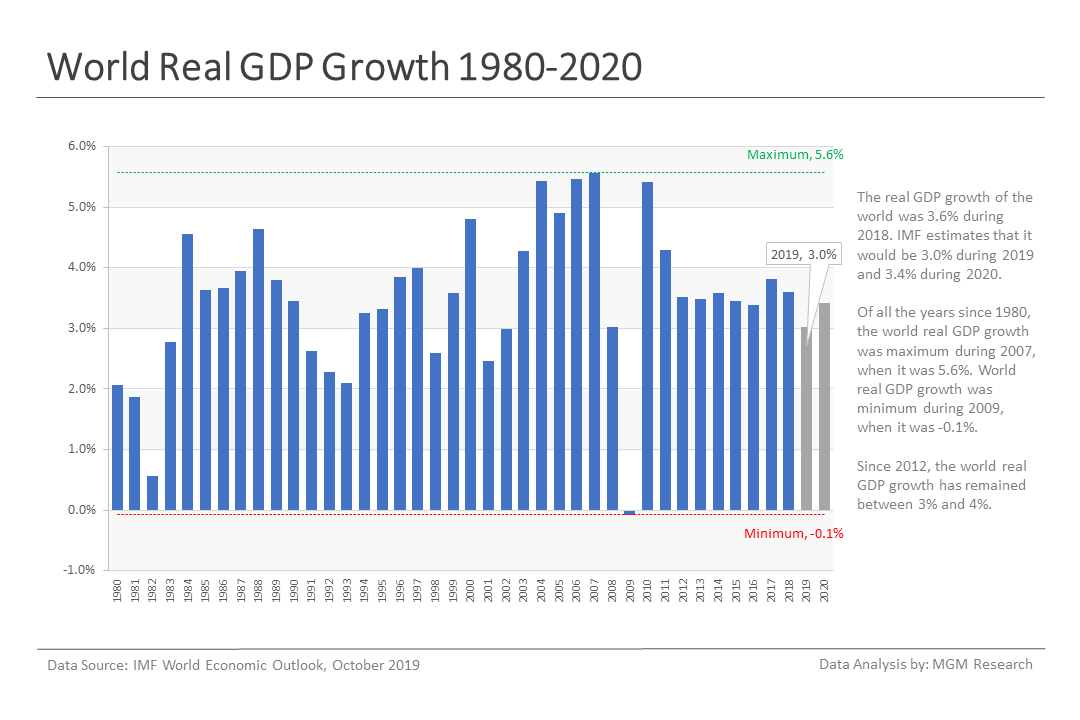
World Real GDP Growth
The real GDP growth of the world was 3.6% during 2018. IMF estimates that the world real GDP growth would come down to 3.0% during 2019 and then increase to 3.4% during 2020. Of all the years since 1980, the world real GDP growth was maximum during 2007, when it was 5.6%. World real GDP growth was minimum during 2009, when it was -0.1%. Since 2012, the world real GDP growth has remained between 3% and 4%. The chart below shows the world real GDP growth from 1980 to 2020.
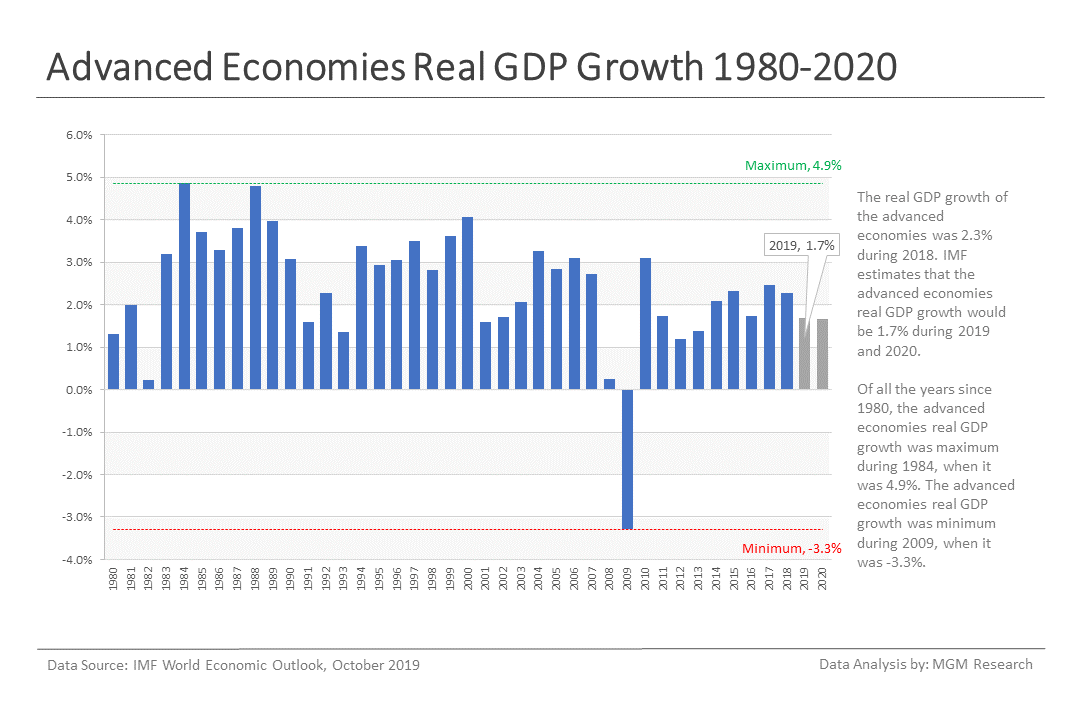
Advanced Economies Real GDP Growth
The real GDP growth of the developed countries (aka advanced economies) was 2.3% during 2018. IMF estimates that the advanced economies real GDP growth would be 1.7% during 2019 and 2020. Of all the years since 1980, the advanced economies real GDP growth was maximum during 1984, when it was 4.9%. The advanced economies real GDP growth was minimum during 2009, when it was -3.3%. The chart below shows the advanced economies real GDP growth from 1980 to 2020.
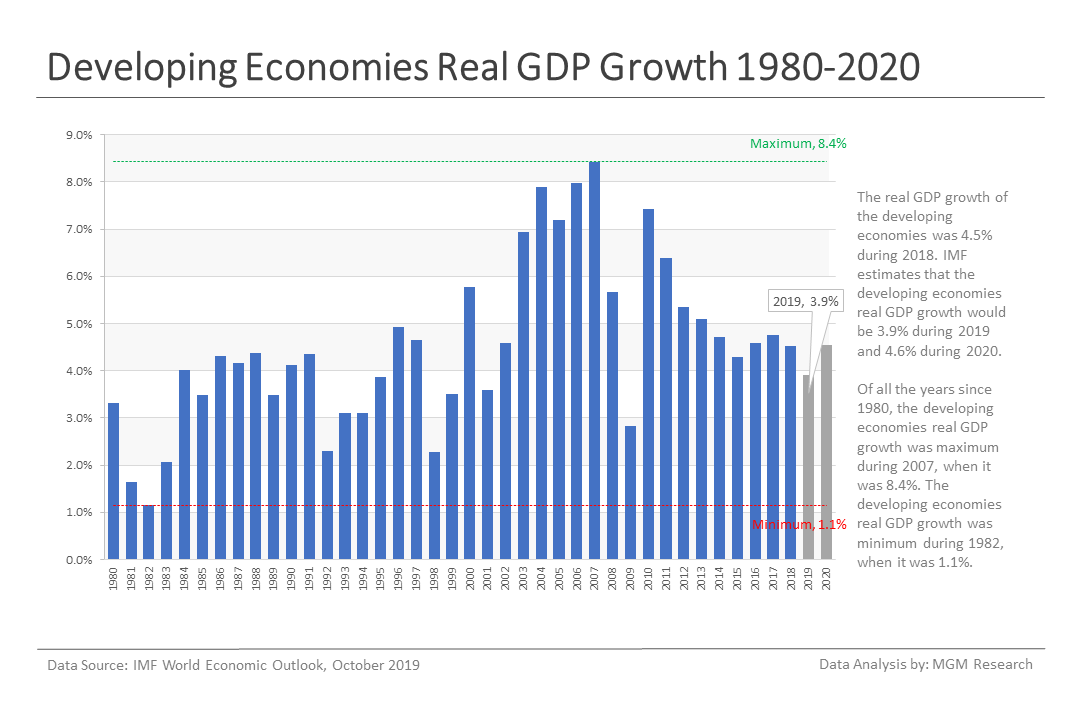
Developing Economies Real GDP Growth
The real GDP growth of the developing countries (aka emerging market and developing economies) was 4.5% during 2018. IMF estimates that the advanced economies real GDP growth would be 3.9% during 2019 and 4.6% during 2020. Of all the years since 1980, the developing economies real GDP growth was maximum during 2007, when it was 8.4%. The developing economies real GDP growth was minimum during 1982, when it was 1.1%. Since 2014, the developing economies real GDP growth has remained between 4% and 5%. The chart below shows the developing economies real GDP growth from 1980 to 2020.
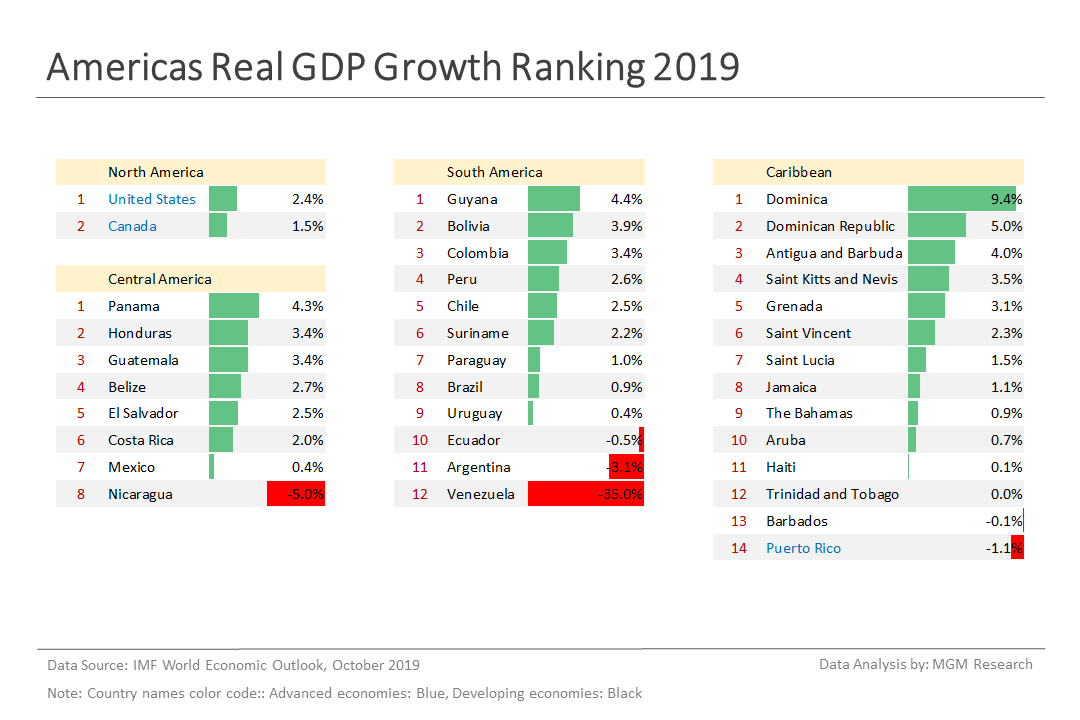
Americas Real GDP Growth by Region
The Americas consist of 36 countries in four regions: North America, Central America, South America, and the Caribbean. IMF real GDP growth forecast 2019 for the different countries in Americas is as follows.
North America - Canada 1.4%, United States 2.5%
Central America - Belize 2.7%, Costa Rica 2.0%, El Salvador 2.5%, Guatemala 3.4%, Honduras 3.4%, Mexico 0.4%, Nicaragua -5.0%, Panama 4.3%
South America - Argentina -3.1%, Bolivia 3.9%, Brazil 0.9%, Chile 2.5%, Colombia 3.4%, Ecuador -0.5%, Guyana 4.4%, Paraguay 1.0%, Peru 2.6%, Suriname 2.2%, Uruguay 0.4%, Venezuela -35.0%
Caribbean - Antigua and Barbuda 4.0%, Aruba 0.7%, The Bahamas 0.9%, Barbados -0.1%, Dominica 9.4%, Dominican Republic 5.0%, Grenada 3.1%, Haiti 0.1%, Jamaica 1.1%, Puerto Rico -1.1%, Saint Kitts and Nevis 3.5%, Saint Lucia 1.5%, Saint Vincent 2.3%, Trinidad and Tobago 0.0%
The chart below provides the IMF real GDP growth forecast 2019 for the 36 countries in Americas.
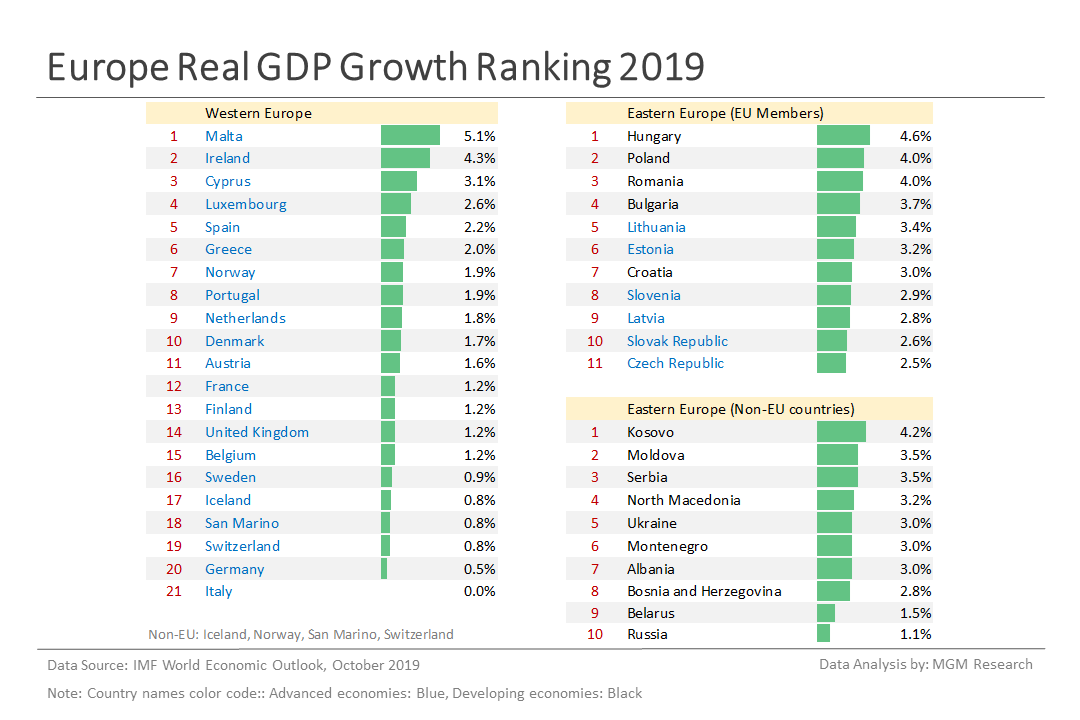
Europe Real GDP Growth by Region
The Europe consists of 42 countries in two regions: Western Europe and Eastern Europe. We further classify Eastern Europe countries into two groups: those who are the members of the European Union (EU) and those who are not. IMF real GDP growth forecast 2019 for the different countries in Europe is as follows.
Western Europe - Austria 1.6%, Belgium 1.2%, Cyprus 3.1%, Denmark 1.7%, Finland 1.2%, France 1.2%, Germany 0.5%, Greece 2.0%, Iceland 0.8%, Ireland 4.3%, Italy 0.0%, Luxembourg 2.6%, Malta 5.1%, Netherlands 1.8%, Norway 1.9%, Portugal 1.9%, San Marino 0.8%, Spain 2.2%, Sweden 0.9%, Switzerland 0.8%, United Kingdom 1.2%
Eastern Europe (EU Members) - Bulgaria 3.7%, Croatia 3.0%, Czech Republic 2.5%, Estonia 3.2%, Hungary 4.6%, Latvia 2.8%, Lithuania 3.4%, Poland 4.0%, Romania 4.0%, Slovak Republic 2.6%, Slovenia 2.9%
Eastern Europe (Non-EU Countries) - Albania 3.0%, Belarus 1.5%, Bosnia and Herzegovina 2.8%, Kosovo 4.2%, Moldova 3.5%, Montenegro 3.0%, North Macedonia 3.2%, Russia 1.1%, Serbia 3.5%, Ukraine 3.0%
The chart below provides the IMF real GDP growth forecast 2019 for the 42 countries in Europe.
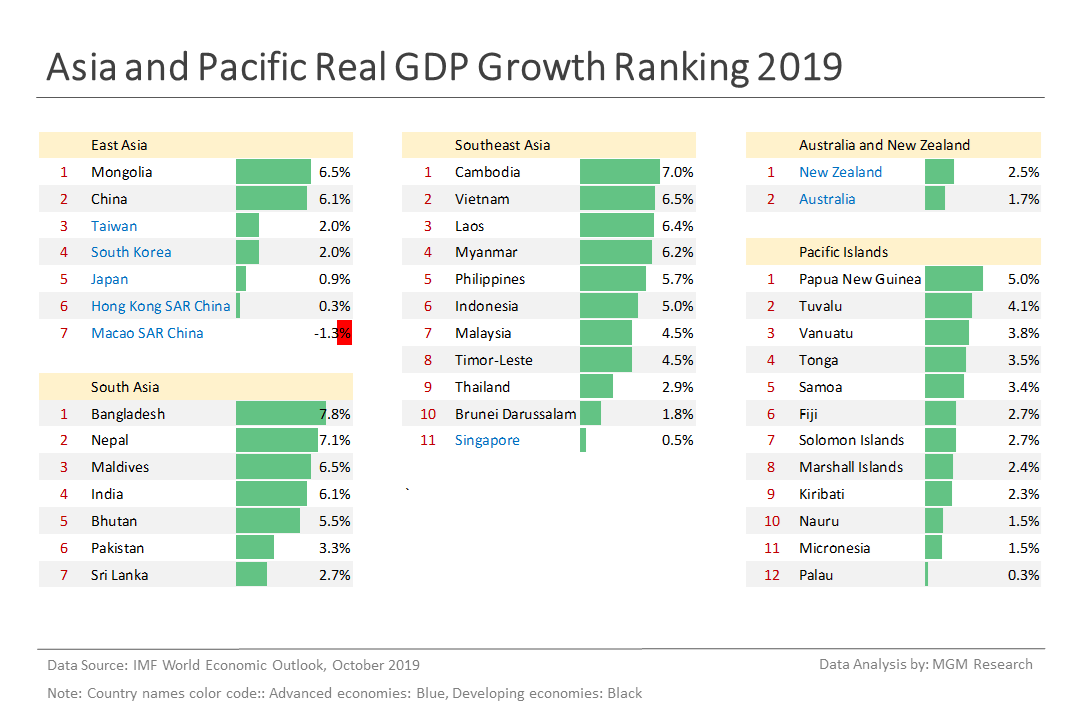
Asia and Pacific Real GDP Growth by Region
The Asia and Pacific consists of 39 countries in five regions: Australia and New Zealand, East Asia, South Asia, Southeast Asia, and Pacific islands. IMF real GDP growth forecast 2019 for the different countries in Asia and Pacific is as follows.
Australia and New Zealand - Australia 1.7%, New Zealand 2.5%
East Asia - China 6.1%, Hong Kong SAR China 0.3%, Japan 0.9%, South Korea 2.0%, Macao SAR China -1.3%, Mongolia 6.5%, Taiwan 2.0%
South Asia - Bangladesh 7.8%, Bhutan 5.5%, India 6.1%, Maldives 6.5%, Nepal 7.1%, Pakistan 3.3%, Sri Lanka 2.7%
Southeast Asia - Brunei Darussalam 1.8%, Cambodia 7.0%, Indonesia 5.0%, Laos 6.4%, Malaysia 4.5%, Myanmar 6.2%, Philippines 5.7%, Singapore 0.5%, Thailand 2.9%, Timor-Leste 4.5%, Vietnam 6.5%
Pacific Islands - Fiji 2.7%, Kiribati 2.3%, Marshall Islands 2.4%, Micronesia 1.5%, Nauru 1.5%, Palau 0.3%, Papua New Guinea 5.0%, Samoa 3.4%, Solomon Islands 2.7%, Tonga 3.5%, Tuvalu 4.1%, Vanuatu 3.8%
The chart below provides the IMF real GDP growth forecast 2019 for the 39 countries in Asia and Pacific.
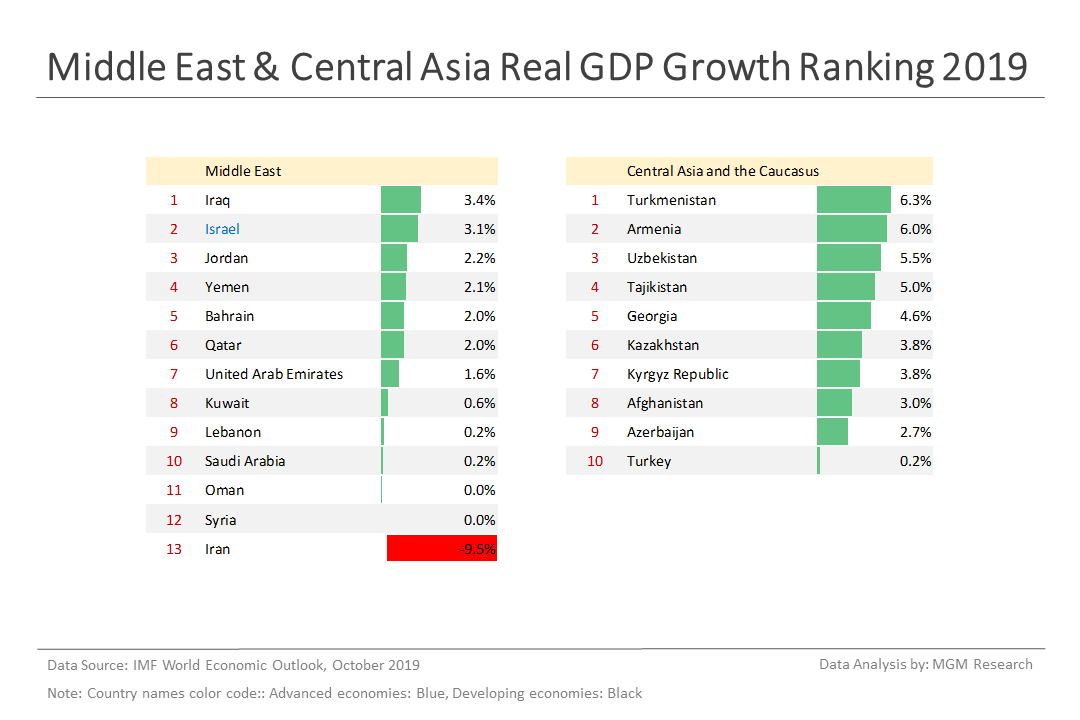
Middle East and Central Asia Real GDP Growth by Region
Middle East and Central Asia consists of 23 countries in two regions: Middle East, Central Asia and the Caucasus. IMF real GDP growth forecast 2019 for the different countries in Middle East and Central Asia is as follows.
Middle East - Bahrain 2.0%, Iran -9.5%, Iraq 3.4%, Israel 3.1%, Jordan 2.2%, Kuwait 0.6%, Lebanon 0.2%, Oman 0.0%, Qatar 2.0%, Saudi Arabia 0.2%, Syria 0.0%, United Arab Emirates 1.6%, Yemen 2.1%
Central Asia and the Caucasus - Afghanistan 3.0%, Armenia 6.0%, Azerbaijan 2.7%, Georgia 4.6%, Kazakhstan 3.8%, Kyrgyz Republic 3.8%, Tajikistan 5.0%, Turkey 0.2%, Turkmenistan 6.3%, Uzbekistan 5.5%
The chart below provides the IMF real GDP growth forecast 2019 for the 23 countries in Middle East and Central Asia.
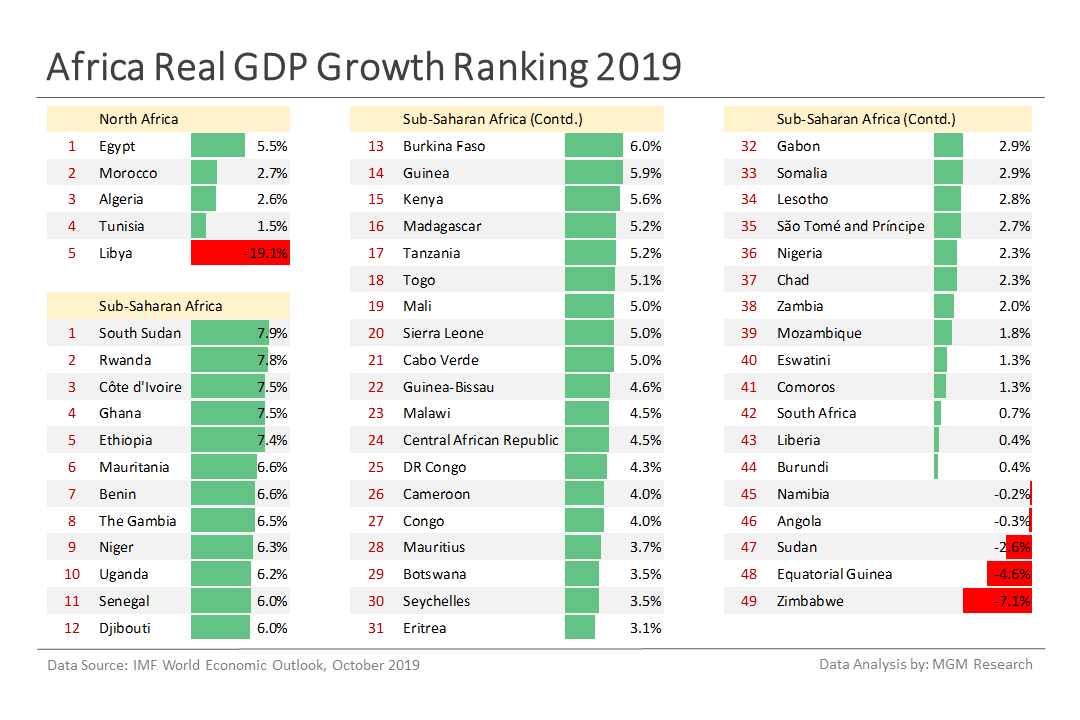
Africa Real GDP Growth by Region
Africa consists of 54 countries in two regions: North Africa and Sub-Saharan Africa. IMF real GDP growth forecast 2019 for the different countries in Africa is as follows.
North Africa - Algeria 2.6%, Egypt 5.5%, Libya -19.1%, Morocco 2.7%, Tunisia 1.5%
Sub-Saharan Africa - Angola -0.3%, Benin 6.6%, Botswana 3.5%, Burkina Faso 6.0%, Burundi 0.4%, Cabo Verde 5.0%, Cameroon 4.0%, Central African Republic 4.5%, Chad 2.3%, Comoros 1.3%, DR Congo 4.3%, Congo 4.0%, Côte d’Ivoire 7.5%, Djibouti 6.0%, Equatorial Guinea -4.6%, Eritrea 3.1%, Eswatini 1.3%, Ethiopia 7.4%, Gabon 2.9%, The Gambia 6.5%, Ghana 7.5%, Guinea 5.9%, Guinea-Bissau 4.6%, Kenya 5.6%, Lesotho 2.8%, Liberia 0.4%, Madagascar 5.2%, Malawi 4.5%, Mali 5.0%, Mauritania 6.6%, Mauritius 3.7%, Mozambique 1.8%, Namibia -0.2%, Niger 6.3%, Nigeria 2.3%, Rwanda 7.8%, São Tomé and Príncipe 2.7%, Senegal 6.0%, Seychelles 3.5%, Sierra Leone 5.0%, Somalia 2.9%, South Africa 0.7%, South Sudan 7.9%, Sudan -2.6%, Tanzania 5.2%, Togo 5.1%, Uganda 6.2%, Zambia 2.0%, Zimbabwe -7.1%
The chart below provides the IMF real GDP growth forecast 2019 for the 54 countries in Africa.
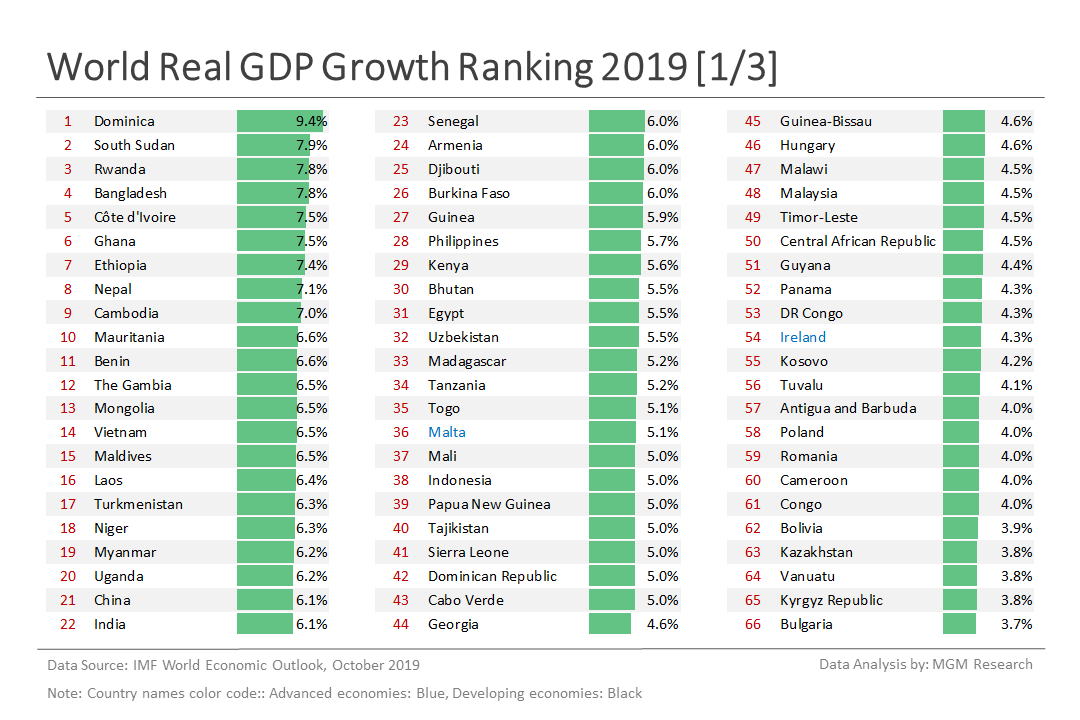
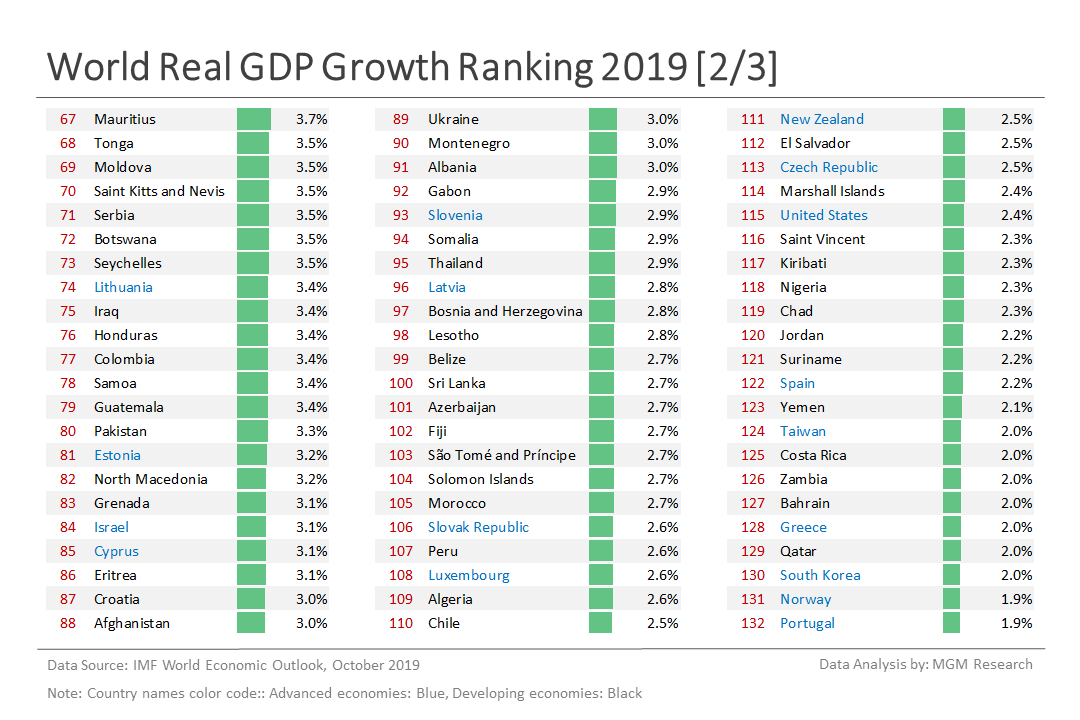
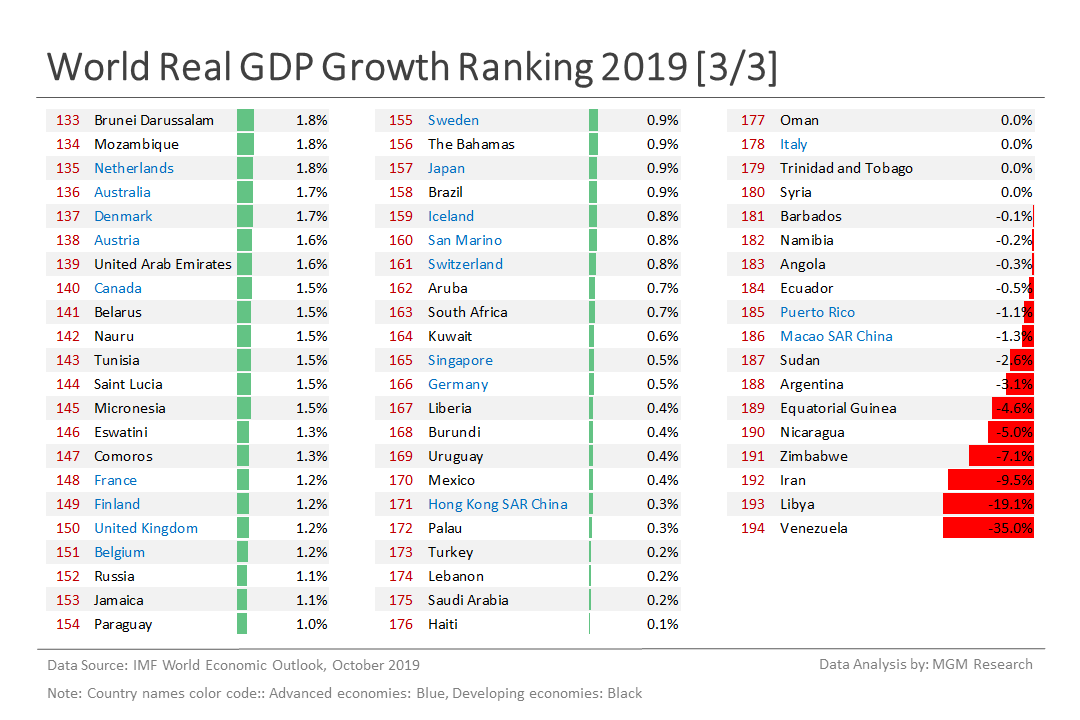
World Real GDP Growth Ranking
Dominica is ranked first with a real GDP growth estimate of 9.4% during 2019. Venezuela is ranked last with a real GDP growth estimate of -35.0% during 2019. Here are the real GDP growth rankings of the world top-10 economies (based on GDP) along with their real GDP growth estimate for 2019.
- The United States is ranked 115 with a real GDP growth of 2.4%.
- China is ranked 21 with a real GDP growth of 6.1%.
- Japan is ranked 157 with a real GDP growth of 0.9%.
- Germany is ranked 166 with a real GDP growth of 0.5%.
- The United Kingdom is ranked 150 with a real GDP growth of 1.2%.
- France is ranked 148 with a real GDP growth of 1.2%.
- India is ranked 22 with a real GDP growth of 6.1%.
- Italy is ranked 178 with a real GDP growth of 0.0%.
- Brazil is ranked 158 with a real GDP growth of 0.9%.
- Canada is ranked 140 with a real GDP growth of 1.5%.
The charts below list real GDP growth of the 194 countries in the world along with their real GDP growth rank.
Notes
- Data Source: International Monetary Fund (IMF) World Economic Outlook (WEO) database, April 2019 edition.
- How does the WEO categorize advanced versus emerging market and developing economies? As per IMF, “The main criteria used by the WEO to classify the world into advanced economies and emerging market and developing economies are (1) per capita income level, (2) export diversification, and (3) degree of integration into the global financial system. Note, however, that these are not the only factors considered in deciding the classification of countries. This classification has evolved over time. The objective is to facilitate analysis by providing a reasonably meaningful method of organizing data. Reclassification only happens when something marked changes or the case for change in terms of the three criteria above becomes overwhelming.”