In this article, we will share the ranking of 191 countries in the world based on their GDP (Gross Domestic Product) per capita on a purchasing power parity basis (GDP PPP) during 2019. We have used the publicly available data from International Monetary Fund (IMF) to rank the countries.
We will first provide the charts for the GDP PPP per capita ranking of the countries grouped by regions. Then, we will provide GDP PPP ranking of all the countries in the world. We will also provide GDP PPP per capita ranking for developed and developing countries. IMF classifies these countries as ‘advanced economies’ and ’emerging market and developing economies’ respectively. Of the 191 countries, 39 countries classified as advanced economies and the remaining are classified as emerging market and developing economies.
This article is part of a series of articles ranking the countries in the world based on their GDP related indicators. In our other articles, we have provided world GDP rankings , world GDP per capita rankings , world GDP PPP (purchasing power parity) rankings , and world real GDP growth rankings.
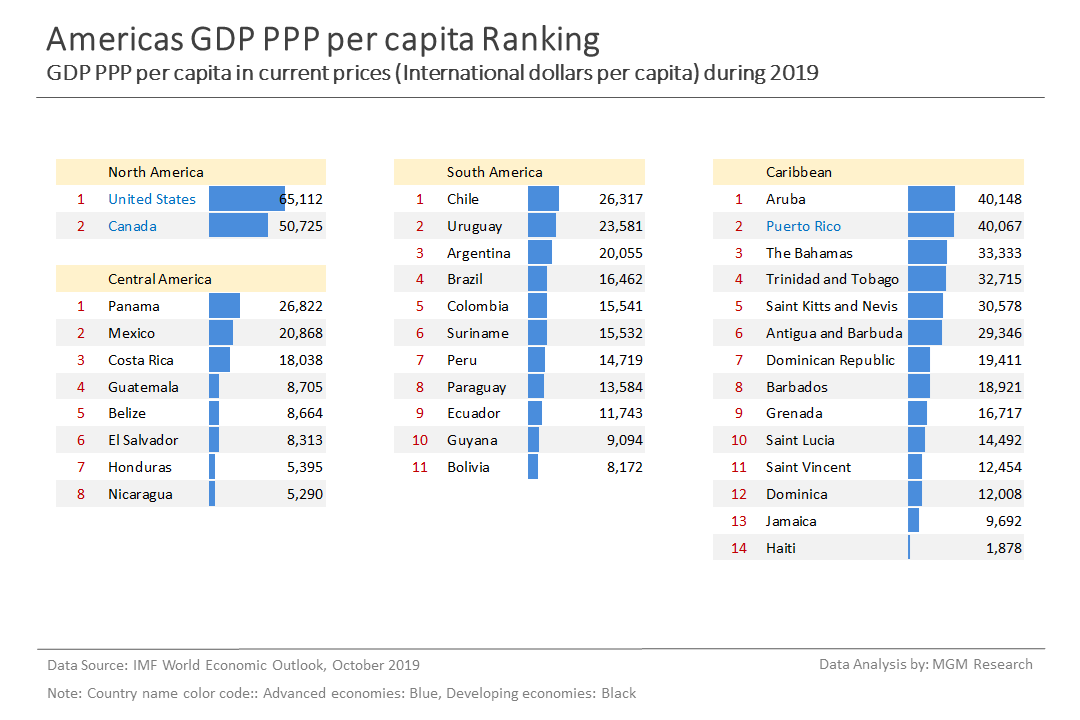
Americas GDP PPP Per Capita Ranking by Region
United States has the highest GDP PPP per capita in the western hemisphere. Panama has the highest GDP PPP per capita in Central America and Chile has the highest GDP PPP per capita in South America. Aruba has the highest GDP PPP per capita among the Caribbean islands. IMF GDP PPP per capita estimate for 2019 for the different countries in the four regions of Americas is as follows.
North America - United States $65,112 , Canada $50,725
Central America - Panama $26,822 , Mexico $20,868 , Costa Rica $18,038 , Guatemala $8,705 , Belize $8,664 , El Salvador $8,313 , Honduras $5,395 , Nicaragua $5,290
South America - Chile $26,317 , Uruguay $23,581 , Argentina $20,055 , Brazil $16,462 , Colombia $15,541 , Suriname $15,532 , Peru $14,719 , Paraguay $13,584 , Ecuador $11,743 , Guyana $9,094 , Bolivia $8,172
Caribbean - Aruba $40,148 , Puerto Rico $40,067 , The Bahamas $33,333 , Trinidad and Tobago $32,715 , Saint Kitts and Nevis $30,578 , Antigua and Barbuda $29,346 , Dominican Republic $19,411 , Barbados $18,921 , Grenada $16,717 , Saint Lucia $14,492 , Saint Vincent $12,454 , Dominica $12,008 , Jamaica $9,692 , Haiti $1,878
The chart below provides the IMF GDP PPP per capita estimate for 2019 for the 35 countries in Americas.
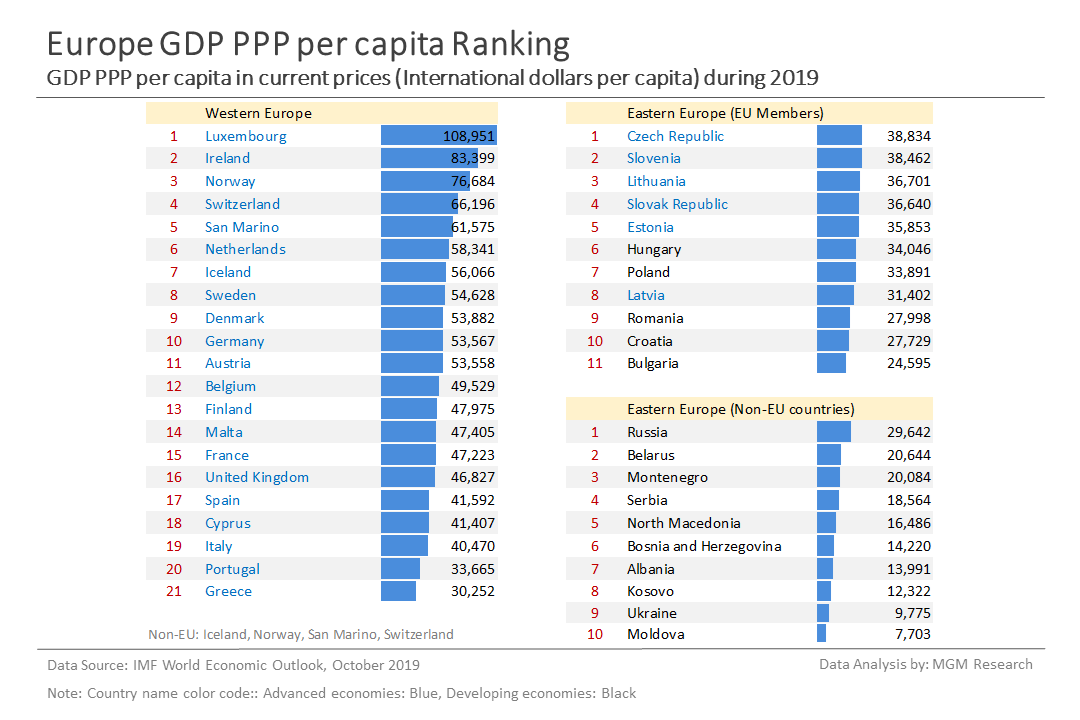
Europe GDP PPP Per Capita Ranking by Region
Luxembourg has the highest GDP PPP per capita in Europe. Luxembourg is followed by Ireland, Norway, Switzerland, and San Marino. Czech Republic has the highest GDP PPP per capita in the Eastern Europe. IMF GDP PPP per capita estimate for 2019 for the different countries in Western and Eastern Europe is as follows.
Western Europe - Luxembourg $108,951 , Ireland $83,399 , Norway $76,684 , Switzerland $66,196 , San Marino $61,575 , Netherlands $58,341 , Iceland $56,066 , Sweden $54,628 , Denmark $53,882 , Germany $53,567 , Austria $53,558 , Belgium $49,529 , Finland $47,975 , Malta $47,405 , France $47,223 , United Kingdom $46,827 , Spain $41,592 , Cyprus $41,407 , Italy $40,470 , Portugal $33,665 , Greece $30,252
Eastern Europe (EU Members) - Czech Republic $38,834 , Slovenia $38,462 , Lithuania $36,701 , Slovak Republic $36,640 , Estonia $35,853 , Hungary $34,046 , Poland $33,891 , Latvia $31,402 , Romania $27,998 , Croatia $27,729 , Bulgaria $24,595
Eastern Europe (Non-EU Countries) - Russia $29,642 , Belarus $20,644 , Montenegro $20,084 , Serbia $18,564 , North Macedonia $16,486 , Bosnia and Herzegovina $14,220 , Albania $13,991 , Kosovo $12,322 , Ukraine $9,775 , Moldova $7,703
The chart below provides the IMF GDP PPP per capita estimate for 2019 for the 42 countries in Europe.
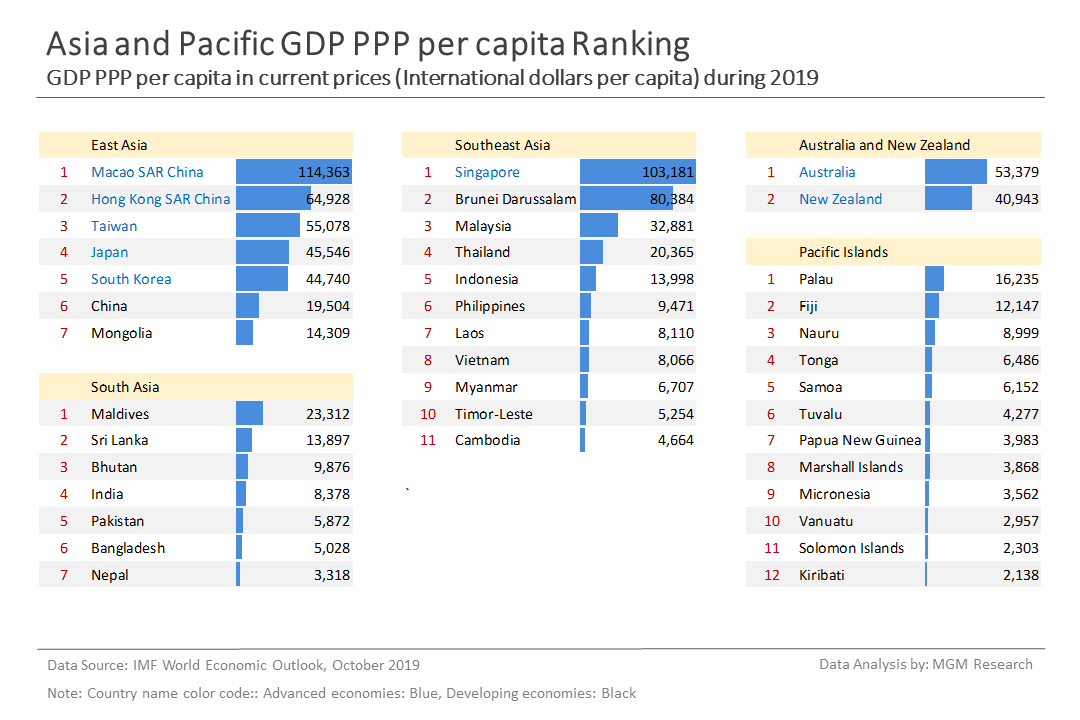
Asia and Pacific GDP PPP Per Capita Ranking by Region
Macao has the highest GDP PPP per capita in Asia and Pacific. Macao is followed by Singapore and Brunei Darussalam. IMF GDP PPP per capita estimate for 2019 for the different countries in the five regions of Asia and Pacific is as follows.
Australia and New Zealand - Australia $53,379 , New Zealand $40,943
East Asia - Macao SAR China $114,363 , Hong Kong SAR China $64,928 , Taiwan $55,078 , Japan $45,546 , South Korea $44,740 , China $19,504 , Mongolia $14,309
South Asia - Maldives $23,312 , Sri Lanka $13,897 , Bhutan $9,876 , India $8,378 , Pakistan $5,872 , Bangladesh $5,028 , Nepal $3,318
Southeast Asia - Singapore $103,181 , Brunei Darussalam $80,384 , Malaysia $32,881 , Thailand $20,365 , Indonesia $13,998 , Philippines $9,471 , Laos $8,110 , Vietnam $8,066 , Myanmar $6,707 , Timor-Leste $5,254 , Cambodia $4,664
Pacific Islands - Palau $16,235 , Fiji $12,147 , Nauru $8,999 , Tonga $6,486 , Samoa $6,152 , Tuvalu $4,277 , Papua New Guinea $3,983 , Marshall Islands $3,868 , Micronesia $3,562 , Vanuatu $2,957 , Solomon Islands $2,303 , Kiribati $2,138
The chart below provides the IMF GDP PPP per capita estimate for 2019 for the 39 countries in Asia and Pacific.
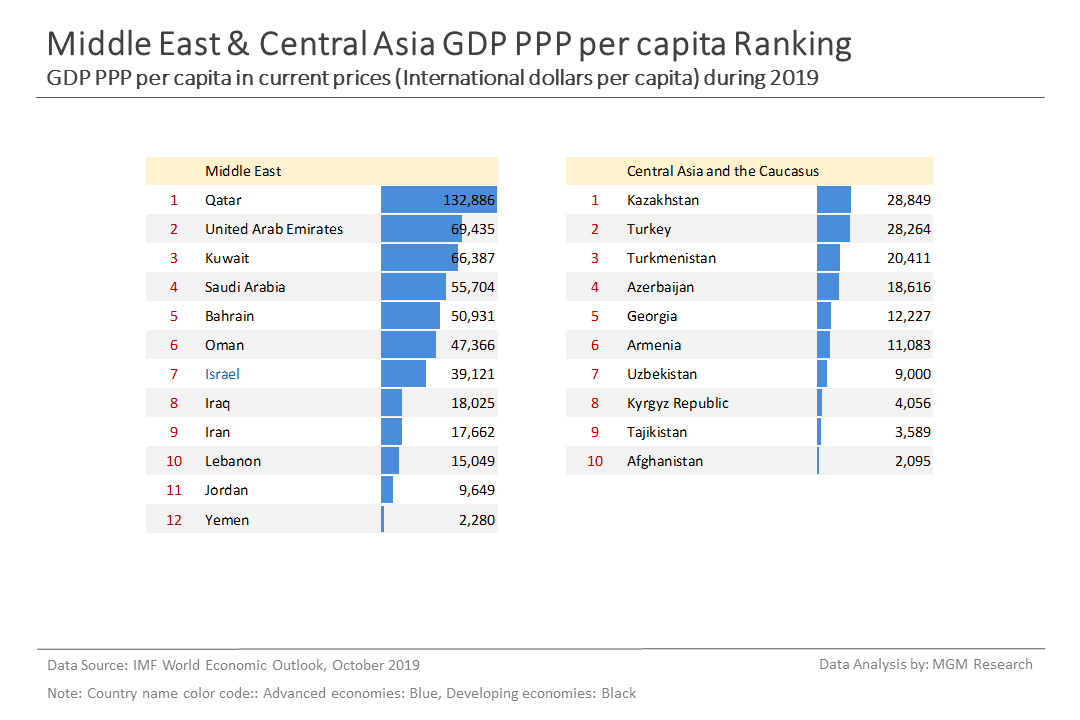
Middle East and Central Asia GDP PPP Per Capita Ranking by Region
Qatar has the highest GDP PPP per capita in Middle East and Central Asia. Qatar is followed by UAE and Kuwait. IMF GDP PPP per capita estimate for 2019 for the different countries in Middle East and Central Asia is as follows.
Middle East - Qatar $132,886 , United Arab Emirates $69,435 , Kuwait $66,387 , Saudi Arabia $55,704 , Bahrain $50,931 , Oman $47,366 , Israel $39,121 , Iraq $18,025 , Iran $17,662 , Lebanon $15,049 , Jordan $9,649 , Yemen $2,280
Central Asia and the Caucasus - Kazakhstan $28,849 , Turkey $28,264 , Turkmenistan $20,411 , Azerbaijan $18,616 , Georgia $12,227 , Armenia $11,083 , Uzbekistan $9,000 , Kyrgyz Republic $4,056 , Tajikistan $3,589 , Afghanistan $2,095
The chart below provides the IMF GDP PPP per capita estimate for 2019 for the 22 countries in Middle East and Central Asia.
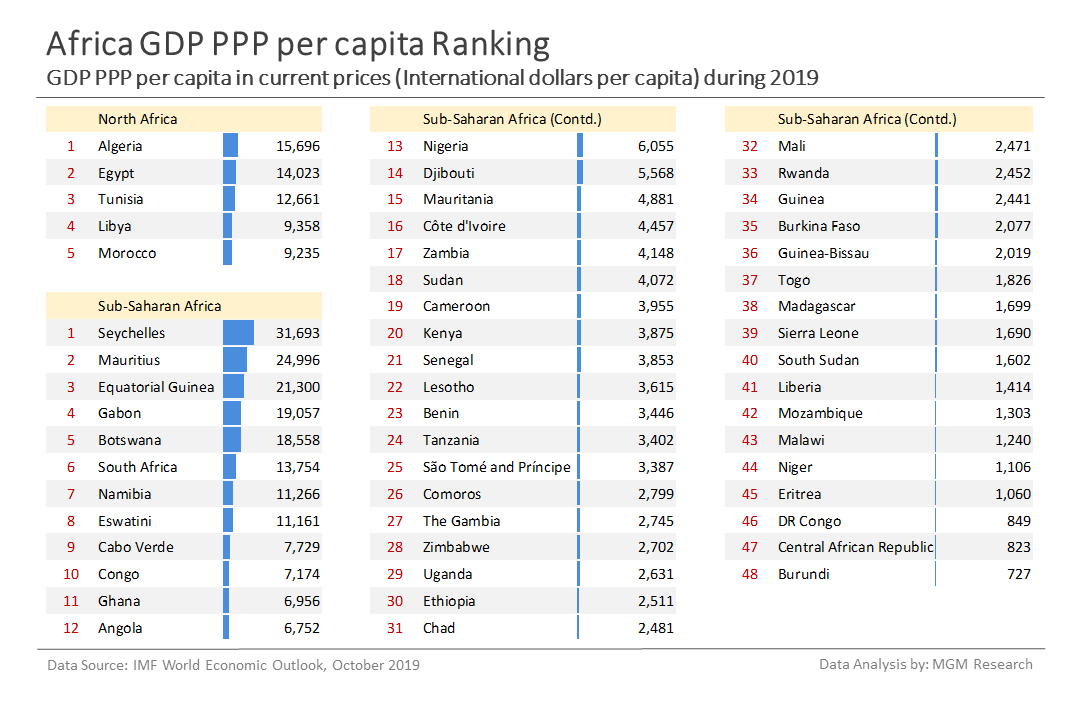
Africa GDP PPP Per Capita Ranking by Region
Seychelles has the highest GDP PPP per capita in Africa. Seychelles is followed by Mauritius and Equatorial Guinea. IMF GDP PPP per capita estimate for 2019 for the different countries in Africa is as follows.
North Africa - Algeria $15,696 , Egypt $14,023 , Tunisia $12,661 , Libya $9,358 , Morocco $9,235
Sub-Saharan Africa - Seychelles $31,693 , Mauritius $24,996 , Equatorial Guinea $21,300 , Gabon $19,057 , Botswana $18,558 , South Africa $13,754 , Namibia $11,266 , Eswatini $11,161 , Cabo Verde $7,729 , Congo $7,174 , Ghana $6,956 , Angola $6,752 , Nigeria $6,055 , Djibouti $5,568 , Mauritania $4,881 , Côte d’Ivoire $4,457 , Zambia $4,148 , Sudan $4,072 , Cameroon $3,955 , Kenya $3,875 , Senegal $3,853 , Lesotho $3,615 , Benin $3,446 , Tanzania $3,402 , São Tomé and Príncipe $3,387 , Comoros $2,799 , The Gambia $2,745 , Zimbabwe $2,702 , Uganda $2,631 , Ethiopia $2,511 , Chad $2,481 , Mali $2,471 , Rwanda $2,452 , Guinea $2,441 , Burkina Faso $2,077 , Guinea-Bissau $2,019 , Togo $1,826 , Madagascar $1,699 , Sierra Leone $1,690 , South Sudan $1,602 , Liberia $1,414 , Mozambique $1,303 , Malawi $1,240 , Niger $1,106 , Eritrea $1,060 , DR Congo $849 , Central African Republic $823 , Burundi $727
The chart below provides the IMF GDP PPP per capita estimate for 2019 for the 53 countries in Africa.
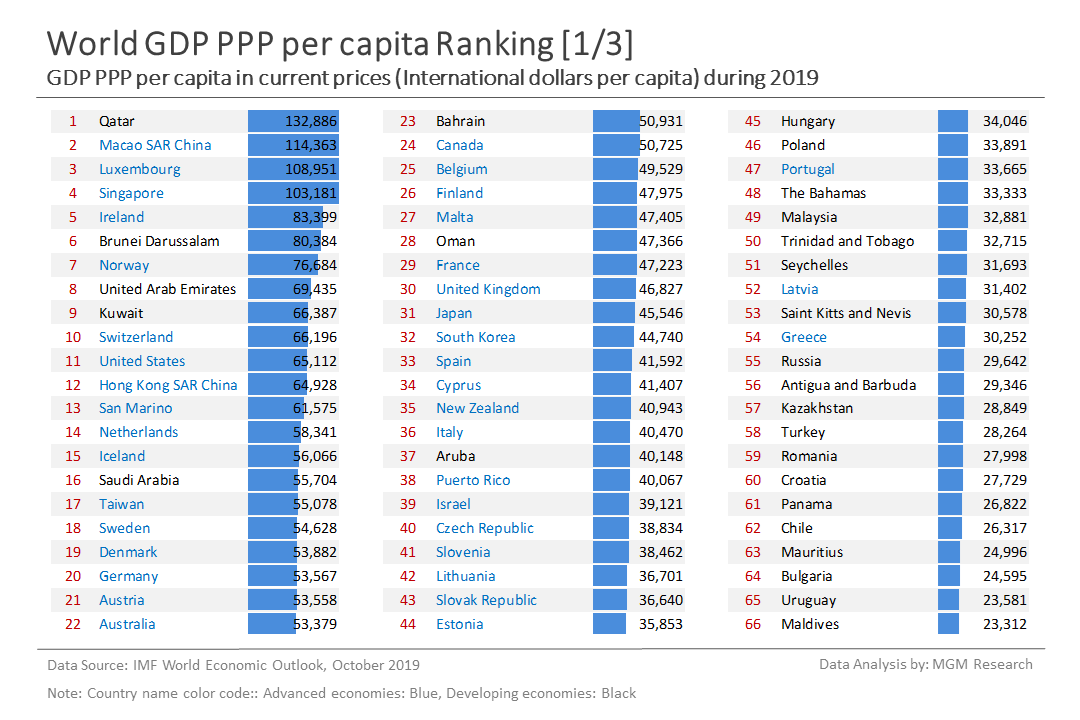
World GDP PPP Per Capita Ranking
Qatar leads the world GDP PPP per capita rankings with a GDP PPP per capita of $132,886 during 2019. Qatar is followed by Macao, Luxembourg, Singapore, and Ireland. Here are the GDP PPP per capita rankings of the world top-10 economies (based on GDP PPP) along with their GDP PPP per capita.
- China is ranked 74 with a GDP PPP per capita of $19,504.
- United States is ranked 11 with a GDP PPP per capita of $65,112.
- India is ranked 124 with a GDP PPP per capita of $8,378.
- Japan is ranked 31 with a GDP PPP per capita of $45,546.
- Germany is ranked 20 with a GDP PPP per capita of $53,567.
- Russia is ranked 55 with a GDP PPP per capita of $29,642.
- Indonesia is ranked 97 with a GDP PPP per capita of $13,998.
- Brazil is ranked 86 with a GDP PPP per capita of $16,462.
- United Kingdom is ranked 30 with a GDP PPP per capita of $46,827.
- France is ranked 29 with a GDP PPP per capita of $47,223.
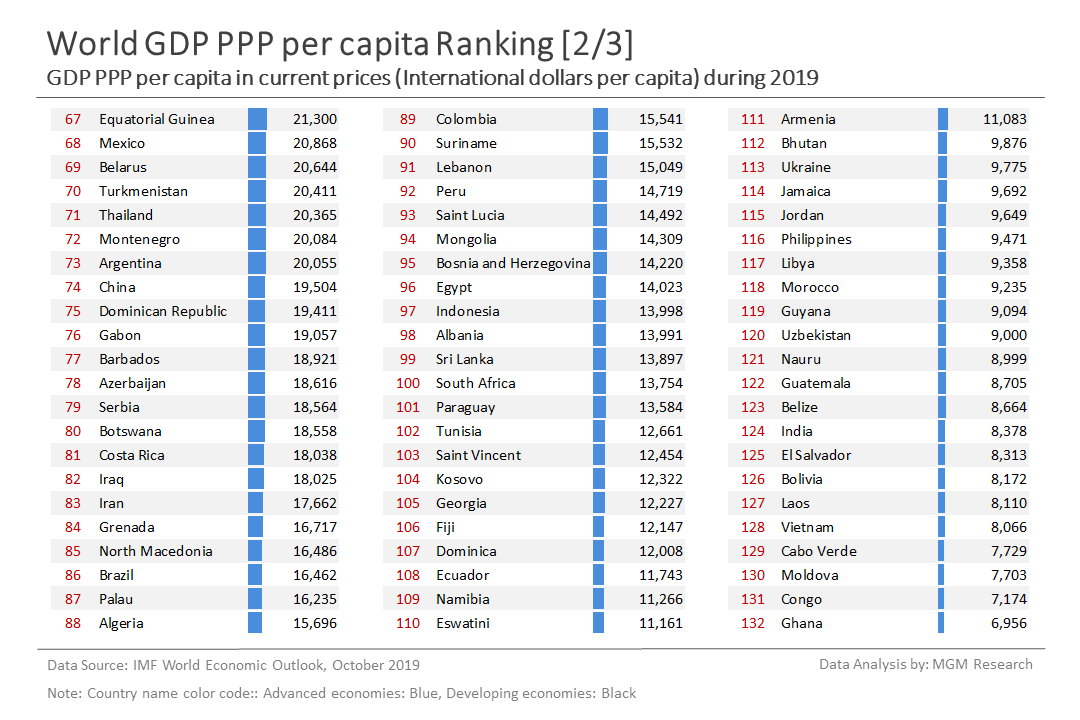
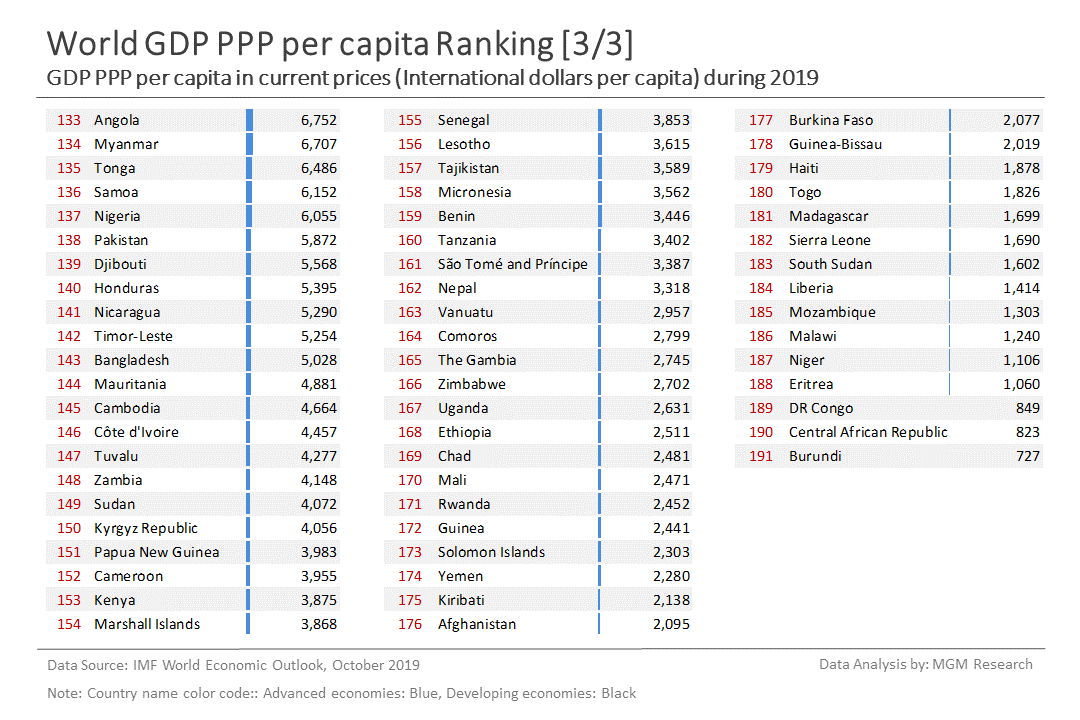
The charts below list all the 191 countries as per their GDP PPP per capita rank.
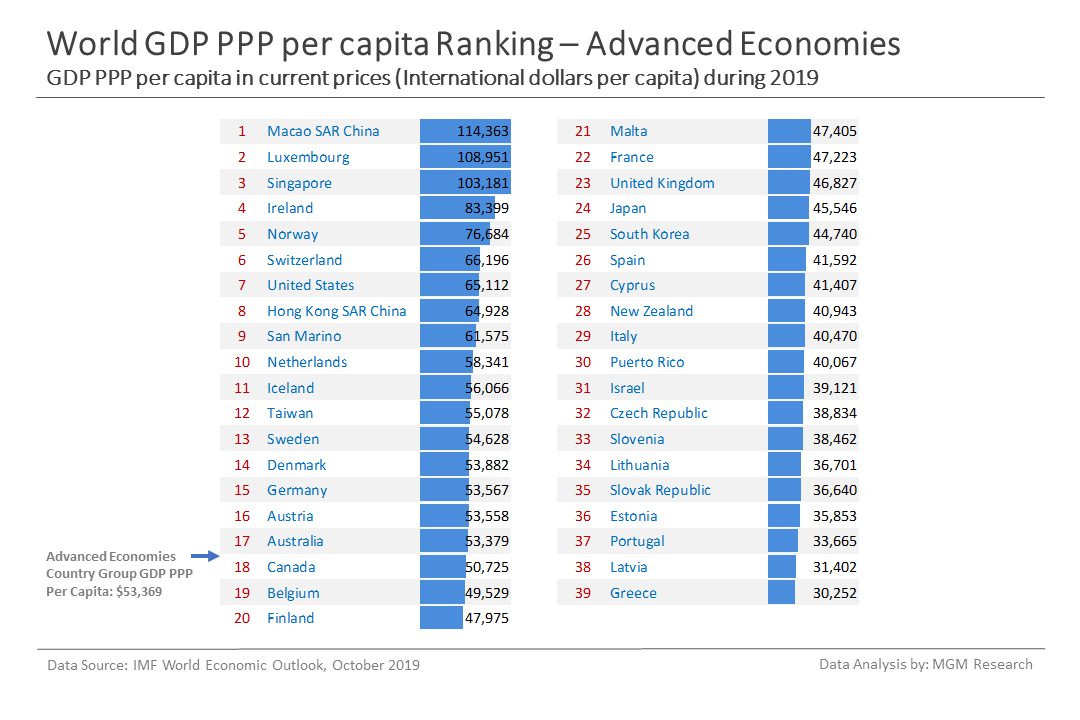
World GDP PPP Per Capita Ranking – Developed countries
Macao leads the developed world GDP PPP per capita rankings with a GDP PPP per capita of $114,363 during 2019. Macao is followed by Luxembourg, Singapore, Ireland, and Norway. 17 of 39 countries have GDP PPP per capita higher than the advanced economies country group GDP PPP per capita. The chart below lists the advanced economies only as per their GDP PPP per capita rank in the developed world.
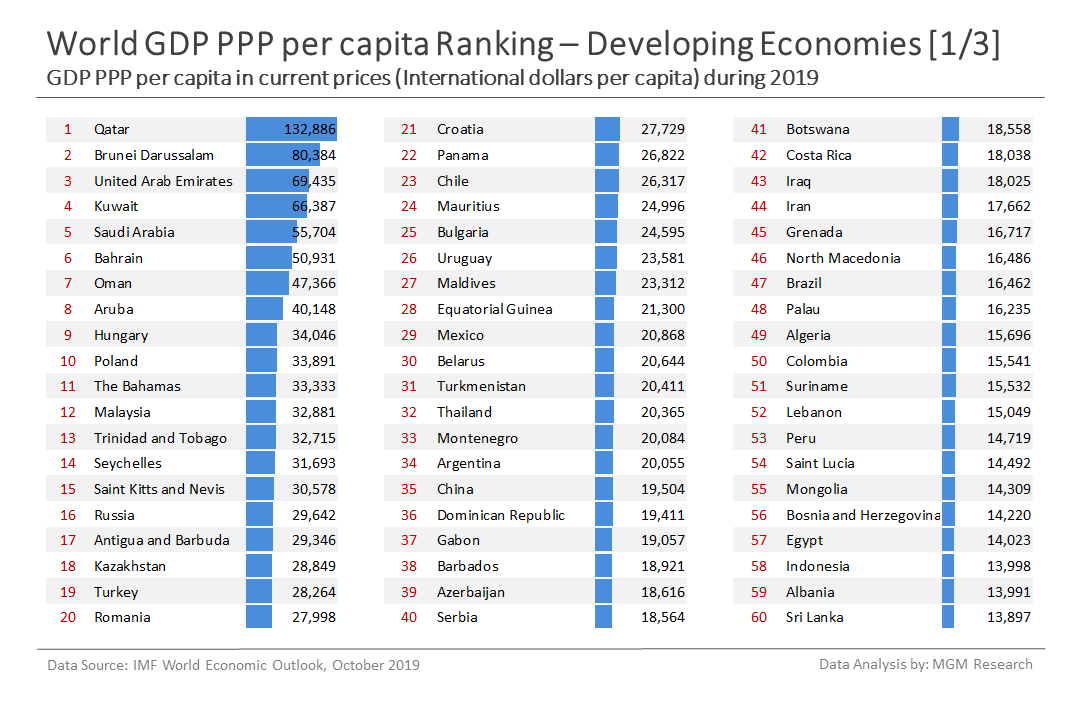
World GDP PPP Per Capita Ranking – Developing countries
Qatar leads the developing world GDP PPP per capita rankings with a GDP PPP per capita of $132,886 during 2019. Qatar is followed by Brunei Darussalam, United Arab Emirates, Kuwait, and Saudi Arabia. 62 of 152 countries have GDP PPP per capita higher than the emerging market and developing economies country group GDP PPP per capita.
Even though top-15 developing countries in the developing world GDP PPP per capita ranking have GDP PPP per capita more than the last ranking country in the developed world (Greece), these countries are not classified as advanced economies. Why?
As per IMF, “The main criteria used by the WEO to classify the world into advanced economies and emerging market and developing economies are (1) per capita income level, (2) export diversification—so oil exporters that have high per capita GDP would not make the advanced classification because around 70% of its exports are oil, and (3) degree of integration into the global financial system. Note, however, that these are not the only factors considered in deciding the classification of countries. This classification has evolved over time. The objective is to facilitate analysis by providing a reasonably meaningful method of organizing data. Reclassification only happens when something marked changes or the case for change in terms of the three criteria above becomes overwhelming.”
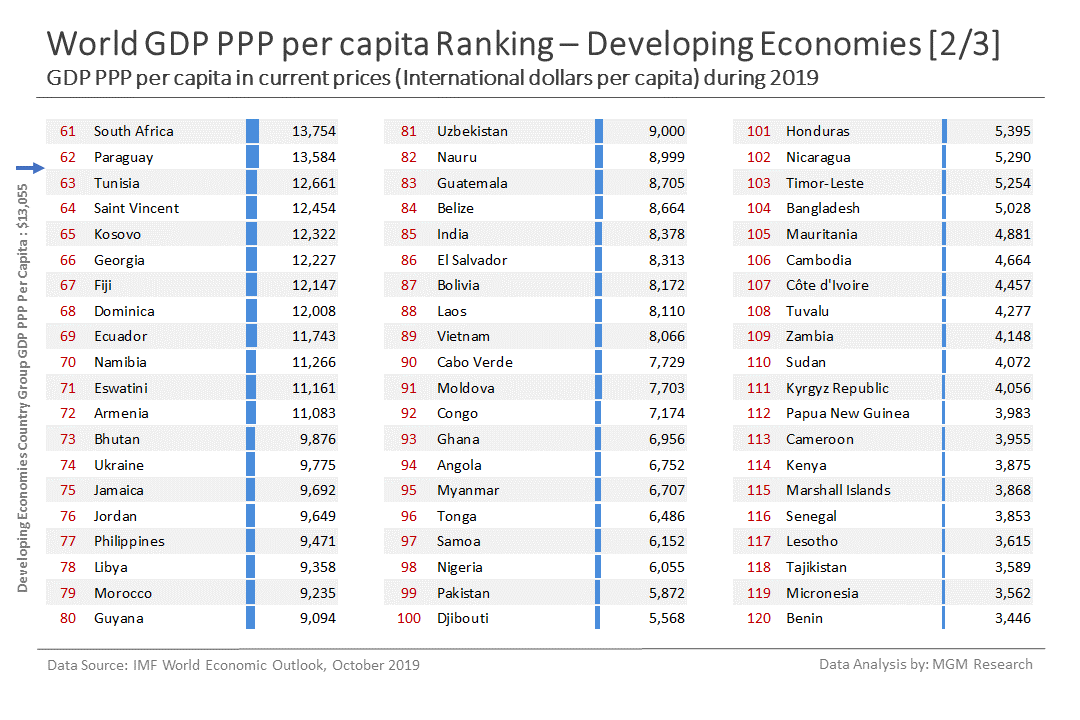
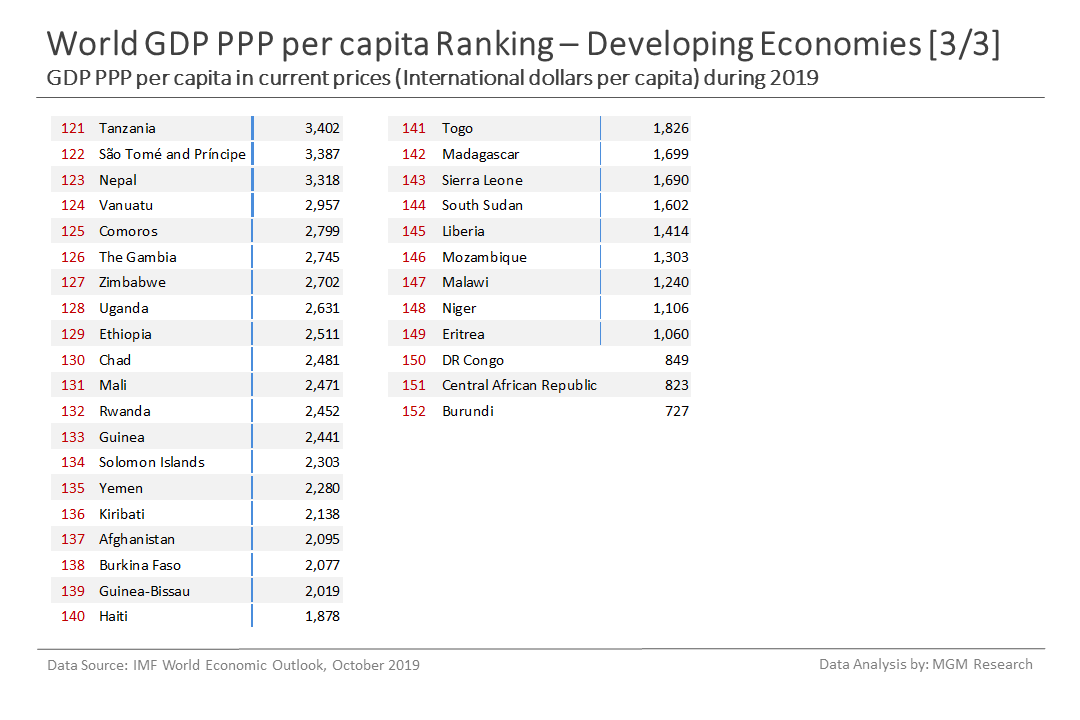
The chart below lists the developing countries as per their GDP PPP per capita rank in the developing world.
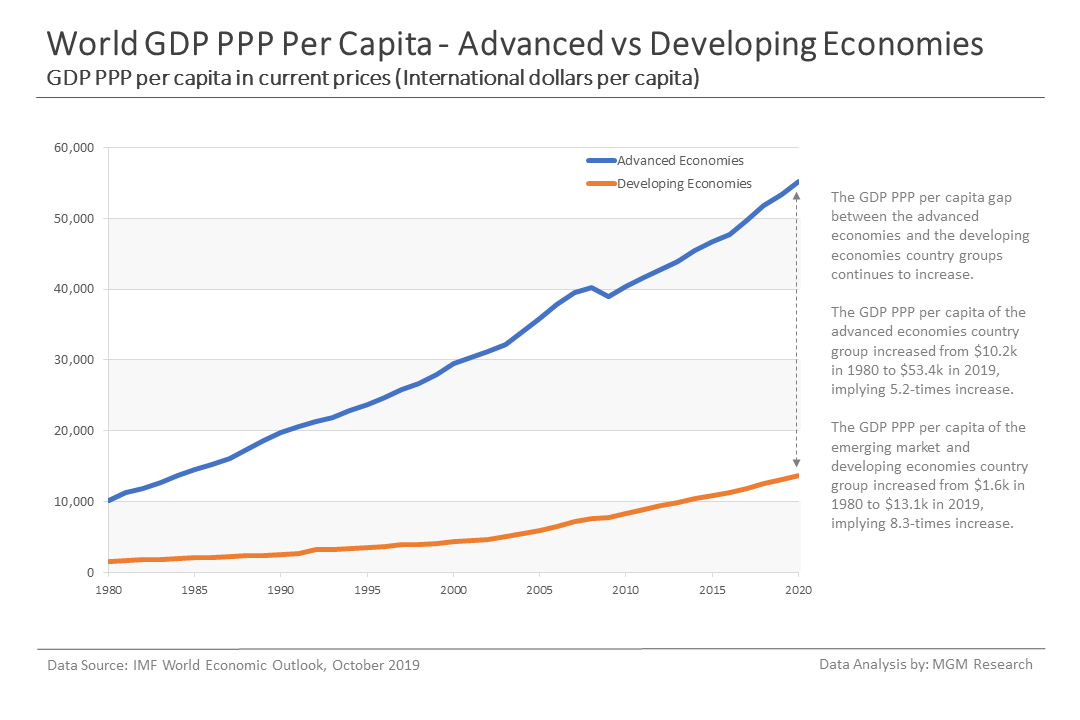
World GDP PPP Per Capita – Advanced vs Developing Economies
The GDP PPP per capita gap between the advanced economies and the developing economies country groups continues to increase.
The GDP PPP per capita of the advanced economies country group increased from $10,186 in 1980 to $53,369 in 2019, implying 5.2-times increase.
The GDP PPP per capita of the emerging market and developing economies country group has increased from $1,578 in 1980 to $13,055 in 2019, implying 8.3-times increase.
The chart below shows the increasing GDP PPP per capita gap between the advanced economies and the developing economies country groups from 1980 to 2020.
Notes
Data Source: International Monetary Fund (IMF) World Economic Outlook (WEO) database, October 2019 edition.