In this article, we will share the ranking of 192 countries in the world based on their GDP (Gross Domestic Product) Per Capita during 2019. We have used the publicly available data from International Monetary Fund (IMF) to rank the countries.
We will first provide the charts for the GDP per capita ranking of the countries grouped by regions. Then, we will provide GDP ranking of all the countries in the world. We will also provide GDP per capita ranking for developed and developing countries. IMF classifies these countries as ‘advanced economies’ and ’emerging market and developing economies’ respectively. Of the 192 countries, 39 countries classified as advanced economies and the remaining are classified as emerging market and developing economies.
This article is part of a series of articles ranking the countries in the world based on their GDP related indicators. In our other articles, we have provided world GDP rankings , world GDP PPP (purchasing power parity) rankings , world GDP PPP per capita rankings , and world real GDP growth rankings.
Americas GDP Per Capita Ranking by Region
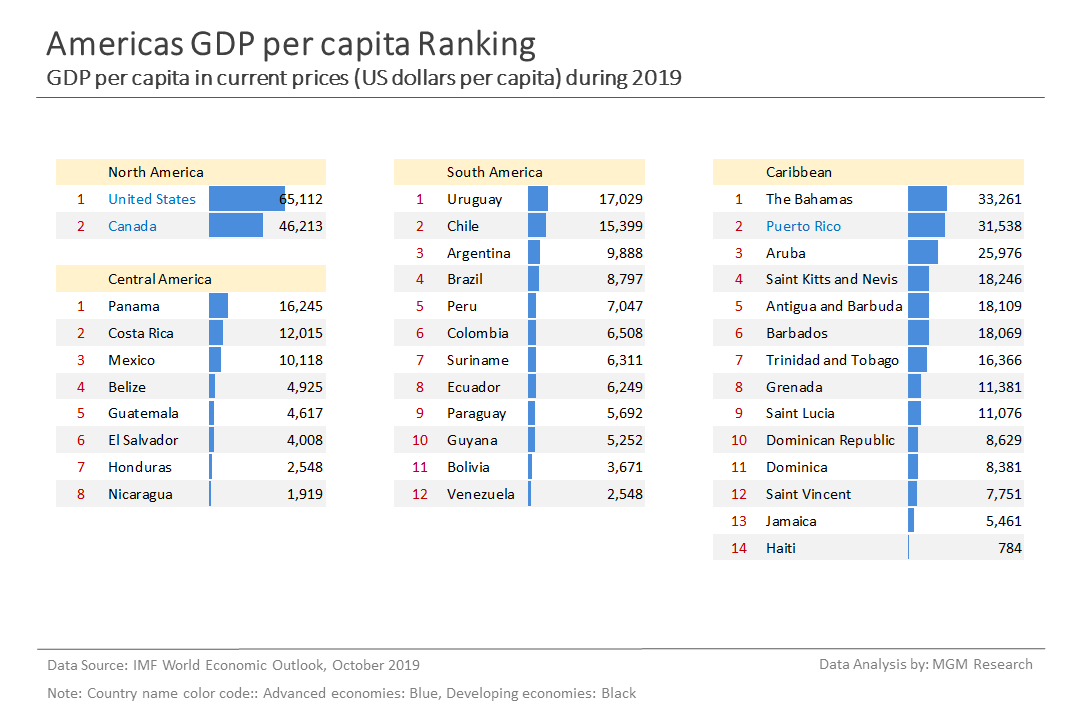
United States has the highest GDP per capita in the western hemisphere. Panama has the highest GDP per capita in Central America and Uruguay has the highest GDP per capita in South America. The Bahamas has the highest GDP per capita among the Caribbean islands. IMF GDP per capita estimate for 2019 for the different countries in the four regions of Americas is as follows.
North America - United States $65,112 , Canada $46,213
Central America - Panama $16,245 , Costa Rica $12,015 , Mexico $10,118 , Belize $4,925 , Guatemala $4,617 , El Salvador $4,008 , Honduras $2,548 , Nicaragua $1,919
South America - Uruguay $17,029 , Chile $15,399 , Argentina $9,888 , Brazil $8,797 , Peru $7,047 , Colombia $6,508 , Suriname $6,311 , Ecuador $6,249 , Paraguay $5,692 , Guyana $5,252 , Bolivia $3,671 , Venezuela $2,548
Caribbean - The Bahamas $33,261 , Puerto Rico $31,538 , Aruba $25,976 , Saint Kitts and Nevis $18,246 , Antigua and Barbuda $18,109 , Barbados $18,069 , Trinidad and Tobago $16,366 , Grenada $11,381 , Saint Lucia $11,076 , Dominican Republic $8,629 , Dominica $8,381 , Saint Vincent $7,751 , Jamaica $5,461 , Haiti $784
The chart below provides the IMF GDP per capita estimate for 2019 for the 36 countries in Americas.
Europe GDP Per Capita Ranking by Region
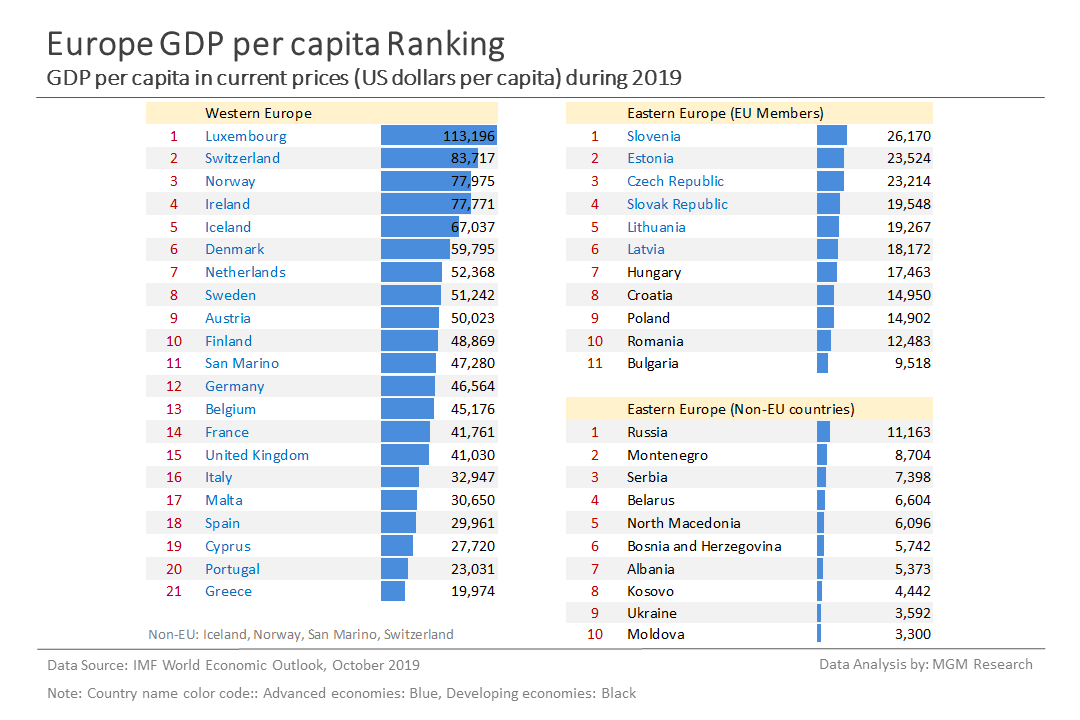
Luxembourg has the highest GDP per capita in Europe. Luxembourg is followed by Switzerland, Norway, Ireland, and Iceland. Slovenia has the highest GDP per capita in the Eastern Europe. IMF GDP per capita estimate for 2019 for the different countries in Western and Eastern Europe is as follows.
Western Europe - Luxembourg $113,196 , Switzerland $83,717 , Norway $77,975 , Ireland $77,771 , Iceland $67,037 , Denmark $59,795 , Netherlands $52,368 , Sweden $51,242 , Austria $50,023 , Finland $48,869 , San Marino $47,280 , Germany $46,564 , Belgium $45,176 , France $41,761 , United Kingdom $41,030 , Italy $32,947 , Malta $30,650 , Spain $29,961 , Cyprus $27,720 , Portugal $23,031 , Greece $19,974
Eastern Europe (EU Members) - Slovenia $26,170 , Estonia $23,524 , Czech Republic $23,214 , Slovak Republic $19,548 , Lithuania $19,267 , Latvia $18,172 , Hungary $17,463 , Croatia $14,950 , Poland $14,902 , Romania $12,483 , Bulgaria $9,518
Eastern Europe (Non-EU Countries) - Russia $11,163 , Montenegro $8,704 , Serbia $7,398 , Belarus $6,604 , North Macedonia $6,096 , Bosnia and Herzegovina $5,742 , Albania $5,373 , Kosovo $4,442 , Ukraine $3,592 , Moldova $3,300
The chart below provides the IMF GDP per capita estimate for 2019 for the 42 countries in Europe.
Asia and Pacific GDP Per Capita Ranking by Region
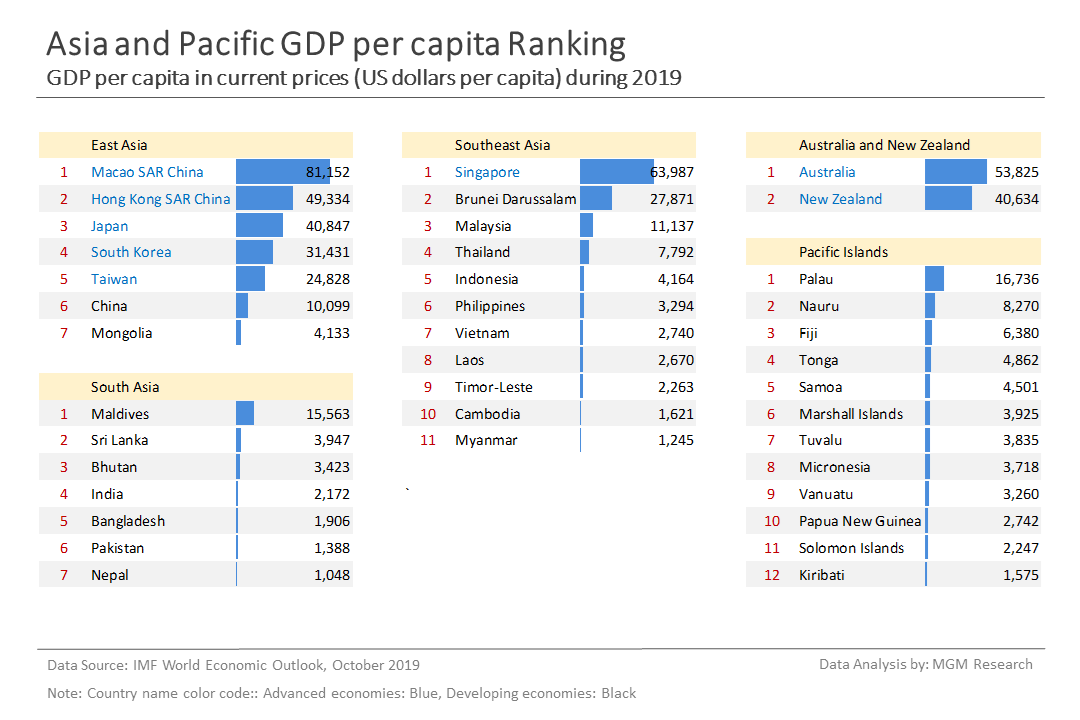
Macao has the highest GDP per capita in Asia and Pacific. Macao is followed by Singapore and Australia. IMF GDP per capita estimate for 2019 for the different countries in the five regions of Asia and Pacific is as follows.
Australia and New Zealand - Australia $53,825 , New Zealand $40,634
East Asia - Macao SAR China $81,152 , Hong Kong SAR China $49,334 , Japan $40,847 , South Korea $31,431 , Taiwan $24,828 , China $10,099 , Mongolia $4,133
South Asia - Maldives $15,563 , Sri Lanka $3,947 , Bhutan $3,423 , India $2,172 , Bangladesh $1,906 , Pakistan $1,388 , Nepal $1,048
Southeast Asia - Singapore $63,987 , Brunei Darussalam $27,871 , Malaysia $11,137 , Thailand $7,792 , Indonesia $4,164 , Philippines $3,294 , Vietnam $2,740 , Laos $2,670 , Timor-Leste $2,263 , Cambodia $1,621 , Myanmar $1,245
Pacific Islands - Palau $16,736 , Nauru $8,270 , Fiji $6,380 , Tonga $4,862 , Samoa $4,501 , Marshall Islands $3,925 , Tuvalu $3,835 , Micronesia $3,718 , Vanuatu $3,260 , Papua New Guinea $2,742 , Solomon Islands $2,247 , Kiribati $1,575
The chart below provides the IMF GDP per capita estimate for 2019 for the 39 countries in Asia and Pacific.
Middle East and Central Asia GDP Per Capita Ranking by Region
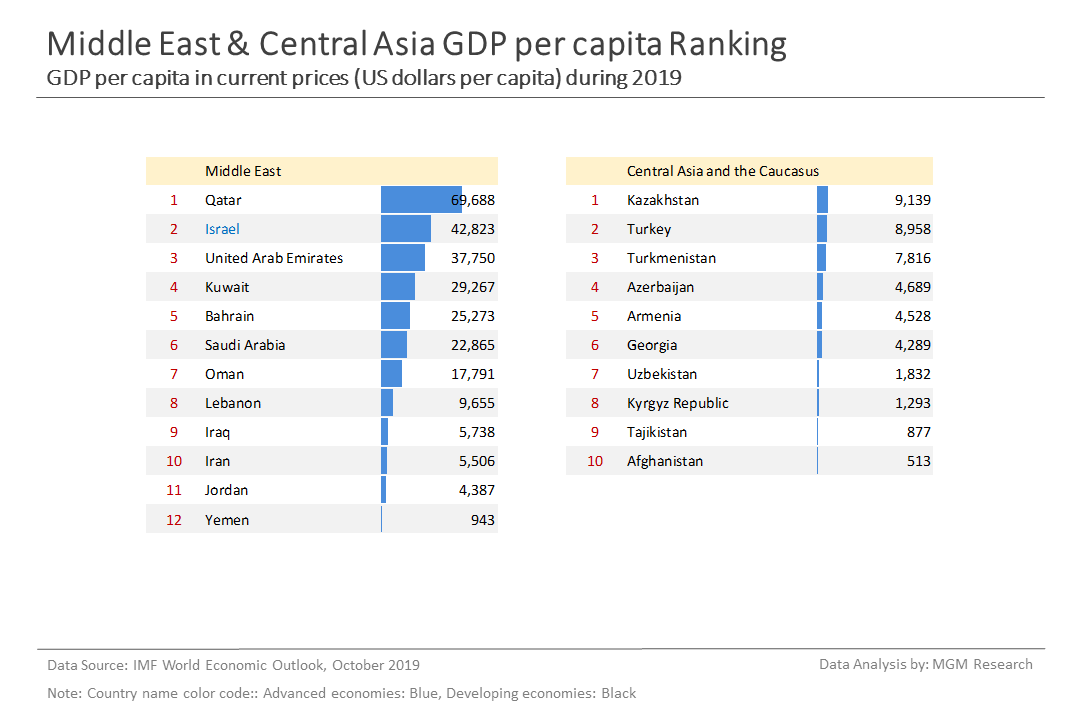
Qatar has the highest GDP per capita in Middle East and Central Asia. Qatar is followed by Israel and UAE. IMF GDP per capita estimate for 2019 for the different countries in Middle East and Central Asia is as follows.
Middle East - Qatar $69,688 , Israel $42,823 , United Arab Emirates $37,750 , Kuwait $29,267 , Bahrain $25,273 , Saudi Arabia $22,865 , Oman $17,791 , Lebanon $9,655 , Iraq $5,738 , Iran $5,506 , Jordan $4,387 , Yemen $943
Central Asia and the Caucasus - Kazakhstan $9,139 , Turkey $8,958 , Turkmenistan $7,816 , Azerbaijan $4,689 , Armenia $4,528 , Georgia $4,289 , Uzbekistan $1,832 , Kyrgyz Republic $1,293 , Tajikistan $877 , Afghanistan $513
The chart below provides the IMF GDP per capita estimate for 2019 for the 22 countries in Middle East and Central Asia.
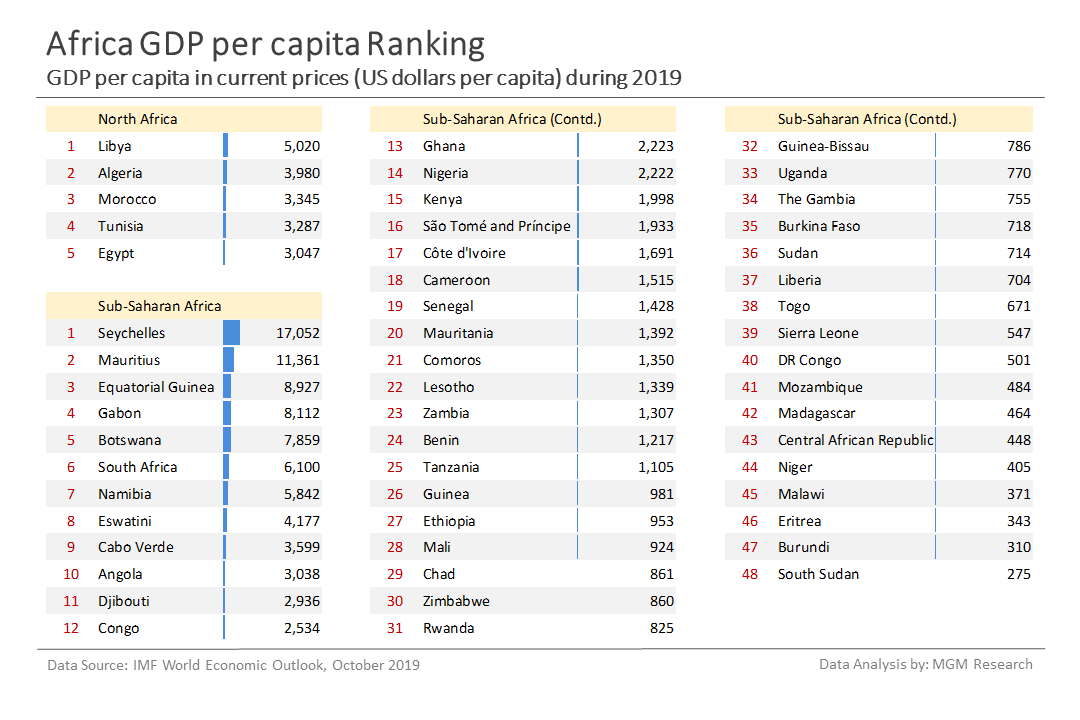
Africa GDP Per Capita Ranking by Region
Seychelles has the highest GDP per capita in Africa. Seychelles is followed by Mauritius and Equatorial Guinea. IMF GDP per capita estimate for 2019 for the different countries in Africa is as follows.
North Africa - Libya $5,020 , Algeria $3,980 , Morocco $3,345 , Tunisia $3,287 , Egypt $3,047
Sub-Saharan Africa - Seychelles $17,052 , Mauritius $11,361 , Equatorial Guinea $8,927 , Gabon $8,112 , Botswana $7,859 , South Africa $6,100 , Namibia $5,842 , Eswatini $4,177 , Cabo Verde $3,599 , Angola $3,038 , Djibouti $2,936 , Congo $2,534 , Ghana $2,223 , Nigeria $2,222 , Kenya $1,998 , São Tomé and Príncipe $1,933 , Côte d’Ivoire $1,691 , Cameroon $1,515 , Senegal $1,428 , Mauritania $1,392 , Comoros $1,350 , Lesotho $1,339 , Zambia $1,307 , Benin $1,217 , Tanzania $1,105 , Guinea $981 , Ethiopia $953 , Mali $924 , Chad $861 , Zimbabwe $860 , Rwanda $825 , Guinea-Bissau $786 , Uganda $770 , The Gambia $755 , Burkina Faso $718 , Sudan $714 , Liberia $704 , Togo $671 , Sierra Leone $547 , DR Congo $501 , Mozambique $484 , Madagascar $464 , Central African Republic $448 , Niger $405 , Malawi $371 , Eritrea $343 , Burundi $310 , South Sudan $275
The chart below provides the IMF GDP per capita estimate for 2019 for the 53 countries in Africa.
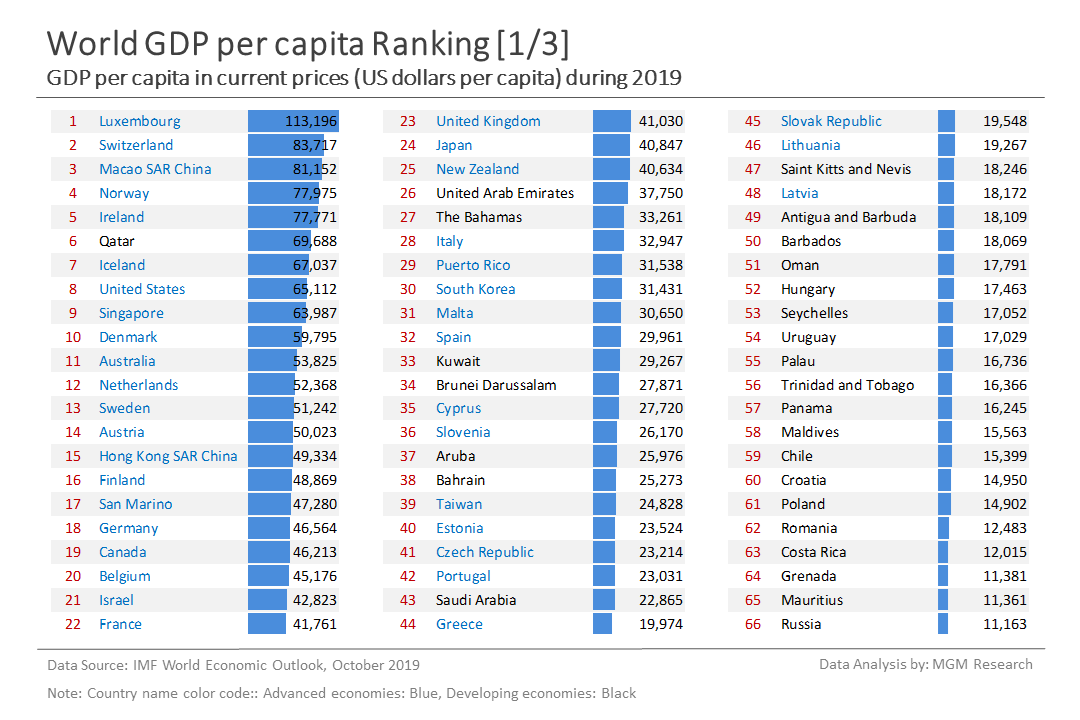
World GDP Per Capita Ranking
Luxembourg leads the world GDP per capita rankings with a GDP per capita of $113,196 during 2019. Luxembourg is followed by Switzerland, Macao, Norway, and Ireland. Here are the GDP per capita rankings of the world top-10 economies (based on GDP) along with their GDP per capita during 2019.
- The United States is ranked 8 with a GDP per capita of $65,112.
- China is ranked is ranked 70 with a GDP per capita of $10,099.
- Japan is ranked 24 with a GDP per capita of $40,847.
- Germany is ranked 18 with a GDP per capita of $46,564.
- India is ranked 145 with a GDP per capita of $2,172.
- The United Kingdom is ranked 23 with a GDP per capita of $41,030.
- France is ranked 22 with a GDP per capita of $41,761.
- Italy is ranked 28 with a GDP per capita of $32,947.
- Brazil is ranked 77 with a GDP per capita of $8,797.
- Canada is ranked 19 with a GDP per capita of $46,213.
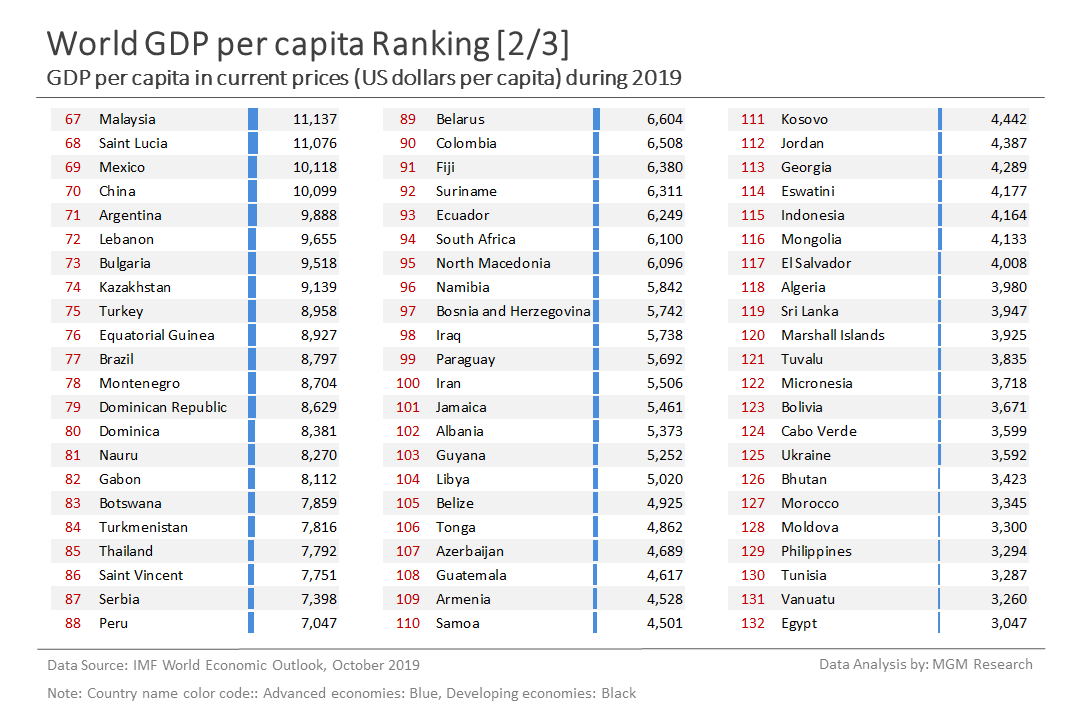
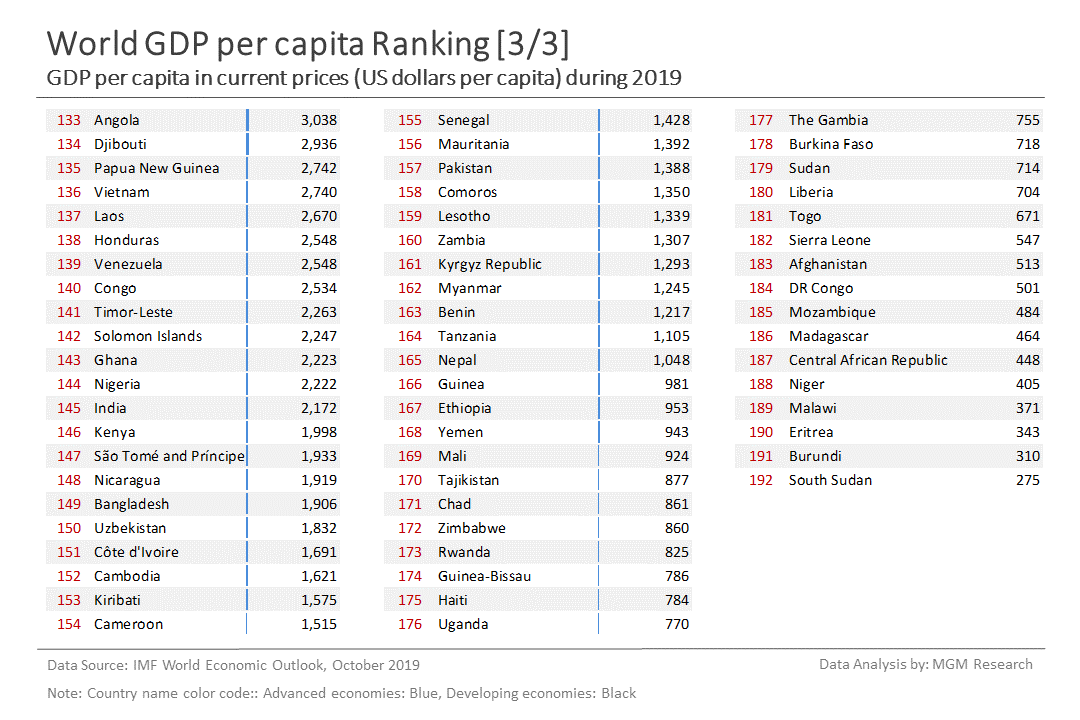
The charts below list all the 192 countries as per their GDP per capita rank.
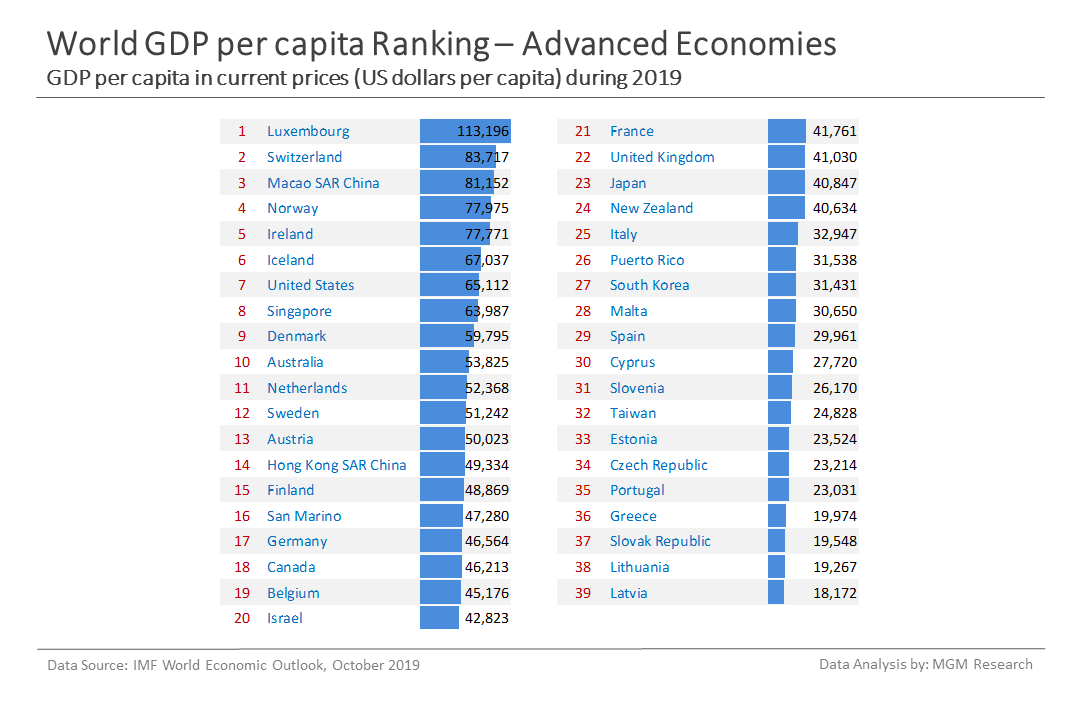
World GDP Per Capita Ranking – Developed countries
In the world GDP per capita rankings provided above, all the 39 advanced economies find place in the world top-50. The chart below lists the advanced economies only as per their GDP per capita rank in the developed world.
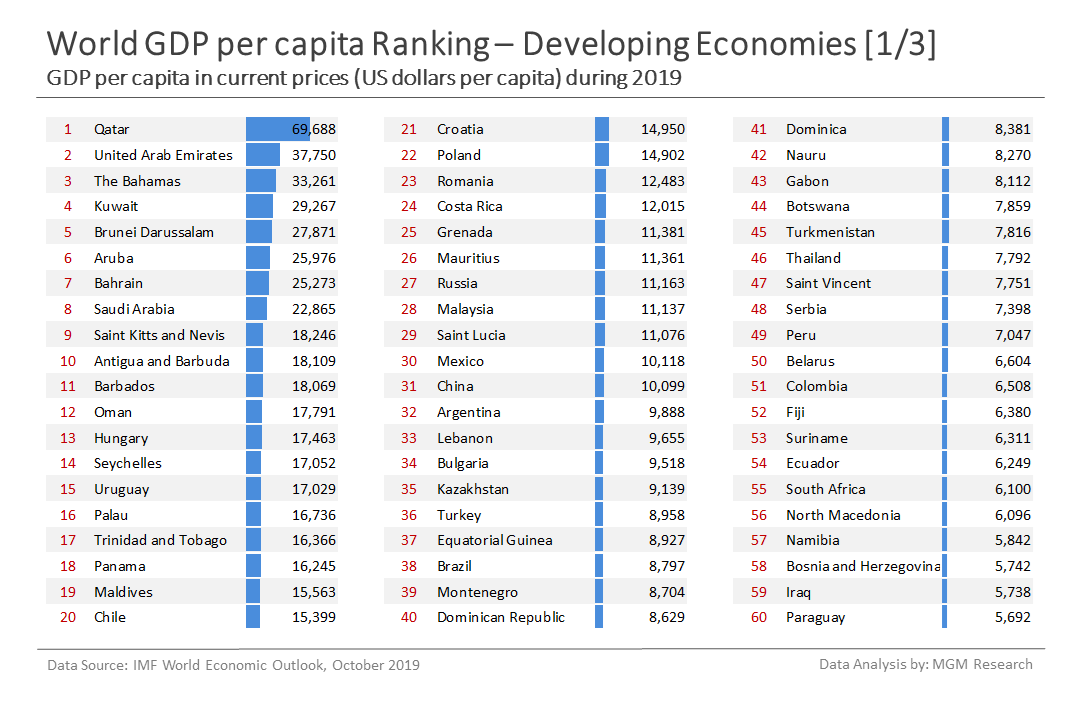
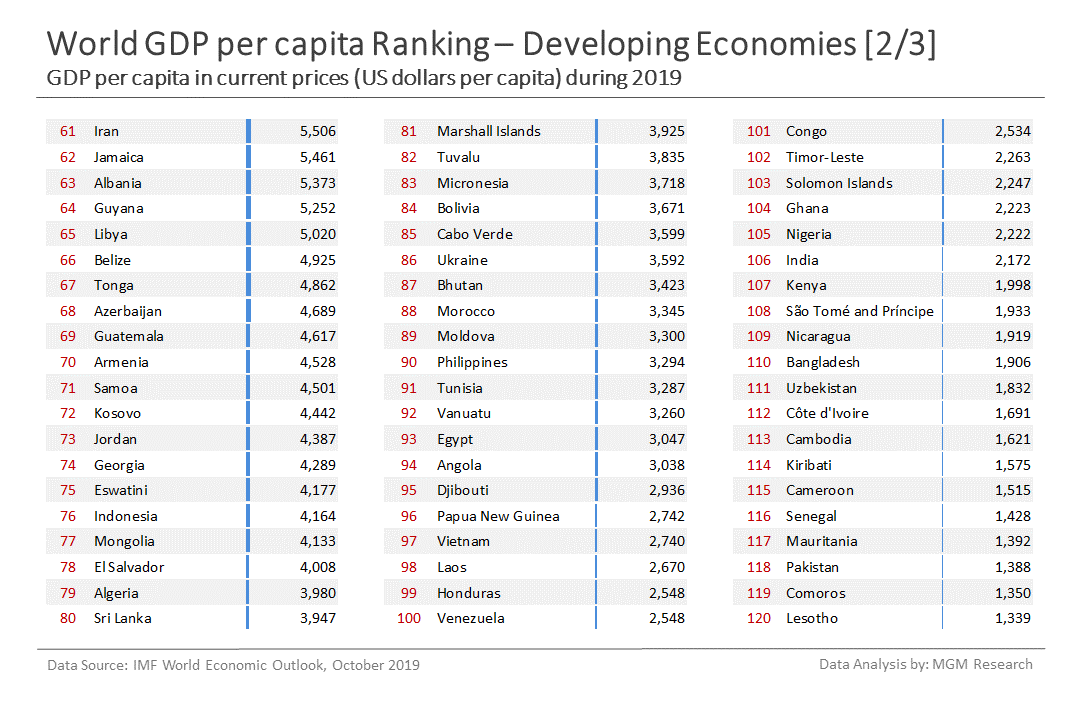
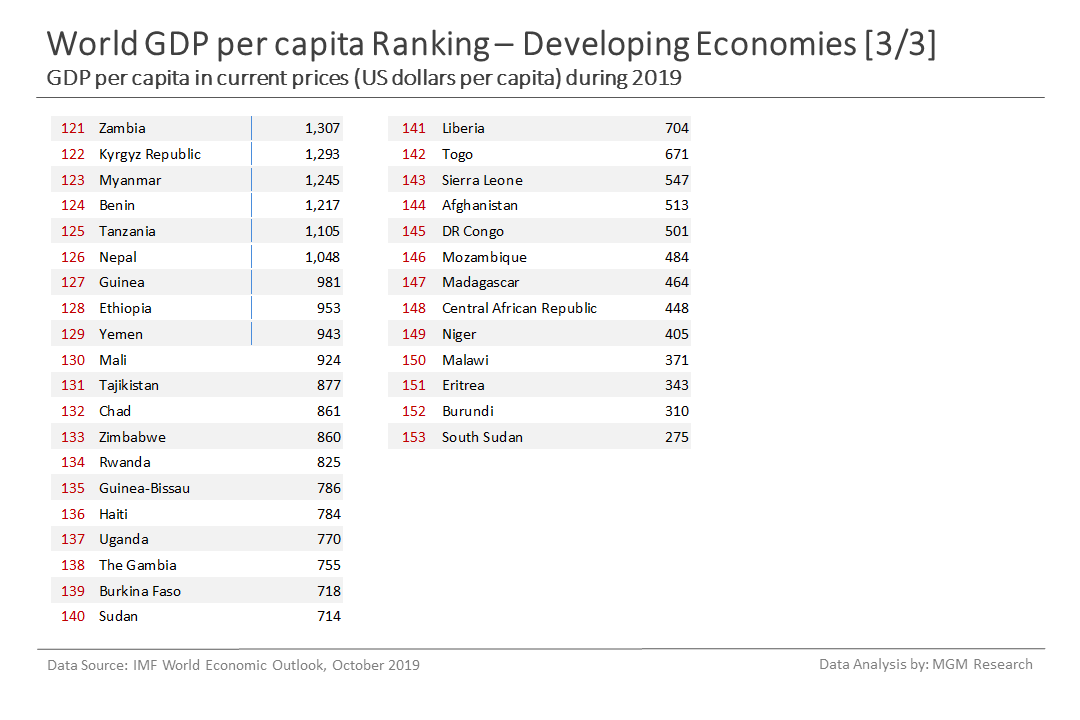
World GDP Per Capita Ranking – Developing countries
Qatar leads the developing world GDP per capita rankings with a GDP per capita of $69,688 during 2019. Qatar is followed by United Arab Emirates, The Bahamas, Kuwait, and Brunei Darussalam.
Even though top-9 developing countries in the developing world GDP per capita ranking have GDP per capita more than the last ranking country in the developed world (Lativa), these countries are not classified as advanced economies. Why?
As per IMF, “The main criteria used by the WEO to classify the world into advanced economies and emerging market and developing economies are (1) per capita income level, (2) export diversification—so oil exporters that have high per capita GDP would not make the advanced classification because around 70% of its exports are oil, and (3) degree of integration into the global financial system. Note, however, that these are not the only factors considered in deciding the classification of countries. This classification has evolved over time. The objective is to facilitate analysis by providing a reasonably meaningful method of organizing data. Reclassification only happens when something marked changes or the case for change in terms of the three criteria above becomes overwhelming.”
The chart below lists the developing countries as per their GDP per capita rank in the developing world.
Notes
Data Source: International Monetary Fund (IMF) World Economic Outlook (WEO) database, October 2019 edition.