In this article, we will share the charts and data for the following indicators related to India Gross Domestic Product (GDP): Nominal GDP, Nominal GDP per capita, GDP on a Purchasing Power Parity (PPP) basis, GDP PPP per capita, and Real GDP Growth. We will present the charts and data for these indicators during the 40-year period from 1980 to 2020. We have used the publicly available data from International Monetary Fund (IMF). The data for 2019 and 2020 are estimates by IMF staff.
To make the charts a little interesting, we have added information about the political parties leading the governments during the different time periods. We have also provided the information about the prime ministers of India from 1980 to 2018. This can help us relate the GDP indicator data during a particular time period with the political party leading the government and its leader. The table below provides information on the prime ministers of India from 1980 to 2018, their political parties (or political alliances), and their office start and end years.
Prime Ministers of India 1980-2018
| Name | Party (Alliance) | Office Term Start | Office Term End |
|---|---|---|---|
| Indira Gandhi | Indian National Congress | Jan-1980 | Oct-1984 |
| Rajiv Gandhi | Indian National Congress | Oct-1984 | Dec-1989 |
| Vishwanath Pratap Singh | Janata Dal (National Front) | Dec-1989 | Nov-1990 |
| Chandra Shekhar | Samajwadi Janata Party with INC | Nov-1990 | Jun-1991 |
| P. V. Narasimha Rao | Indian National Congress | Jun-1991 | May-1996 |
| Atal Bihari Vajpayee | Bharatiya Janata Party | May-1996 | Jun-1996 |
| H. D. Deve Gowda | Janata Dal (United Front) | Jun-1996 | Apr-1997 |
| Inder Kumar Gujral | Janata Dal (United Front) | Apr-1997 | Mar-1998 |
| Atal Bihari Vajpayee | Bharatiya Janata Party (NDA) | Mar-1998 | May-2004 |
| Manmohan Singh | Indian National Congress (UPA) | May-2004 | May-2014 |
| Narendra Modi | Bharatiya Janata Party (NDA) | May-2014 | Incumbent |
Source: Wikipedia (https://en.wikipedia.org/wiki/List_of_Prime_Ministers_of_India)
India GDP 1980-2020
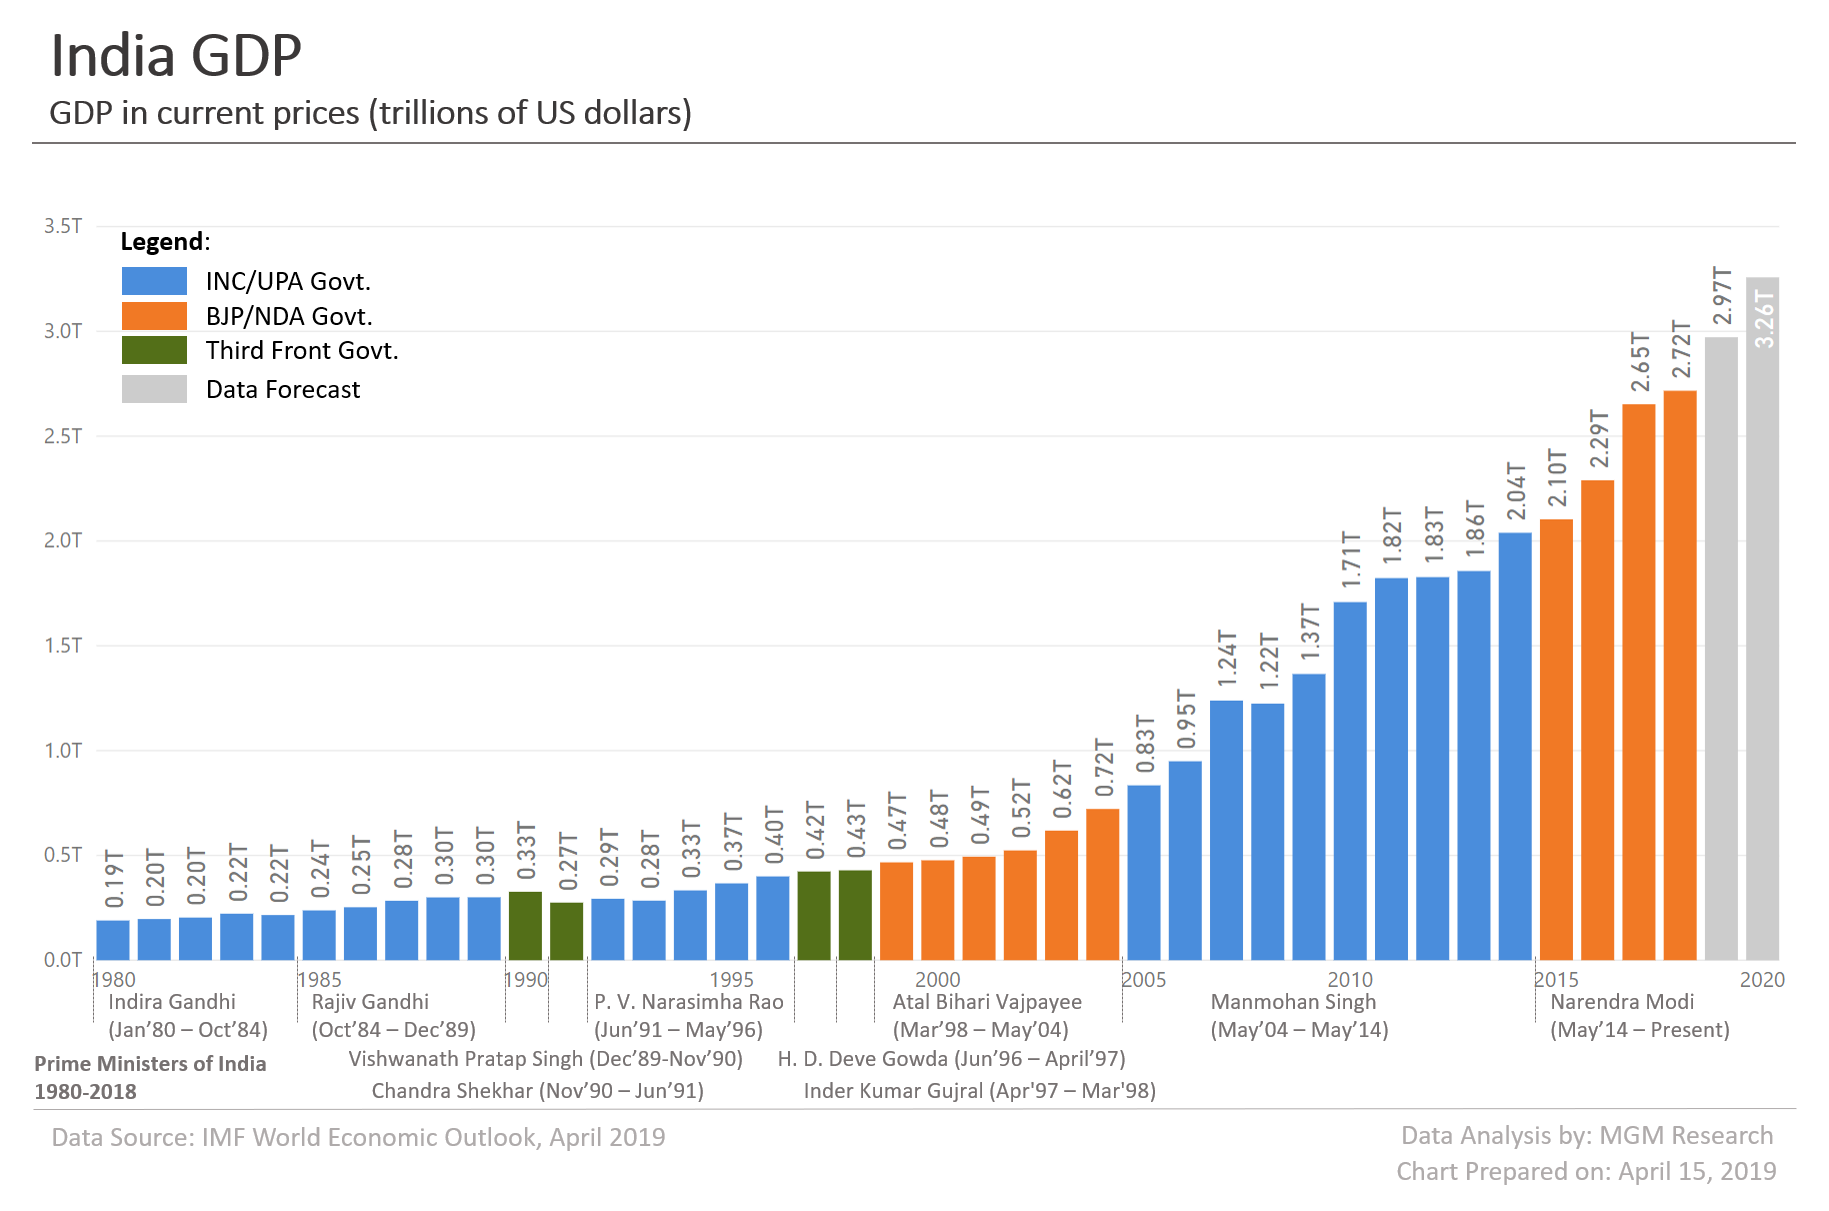
India nominal GDP reached $2.72 trillion during 2018. IMF estimates India GDP to reach $2.97 trillion during 2019 and $3.26 trillion during 2020. The chart below provides India GDP data from 1980 to 2020.
India GDP per capita 1980-2020
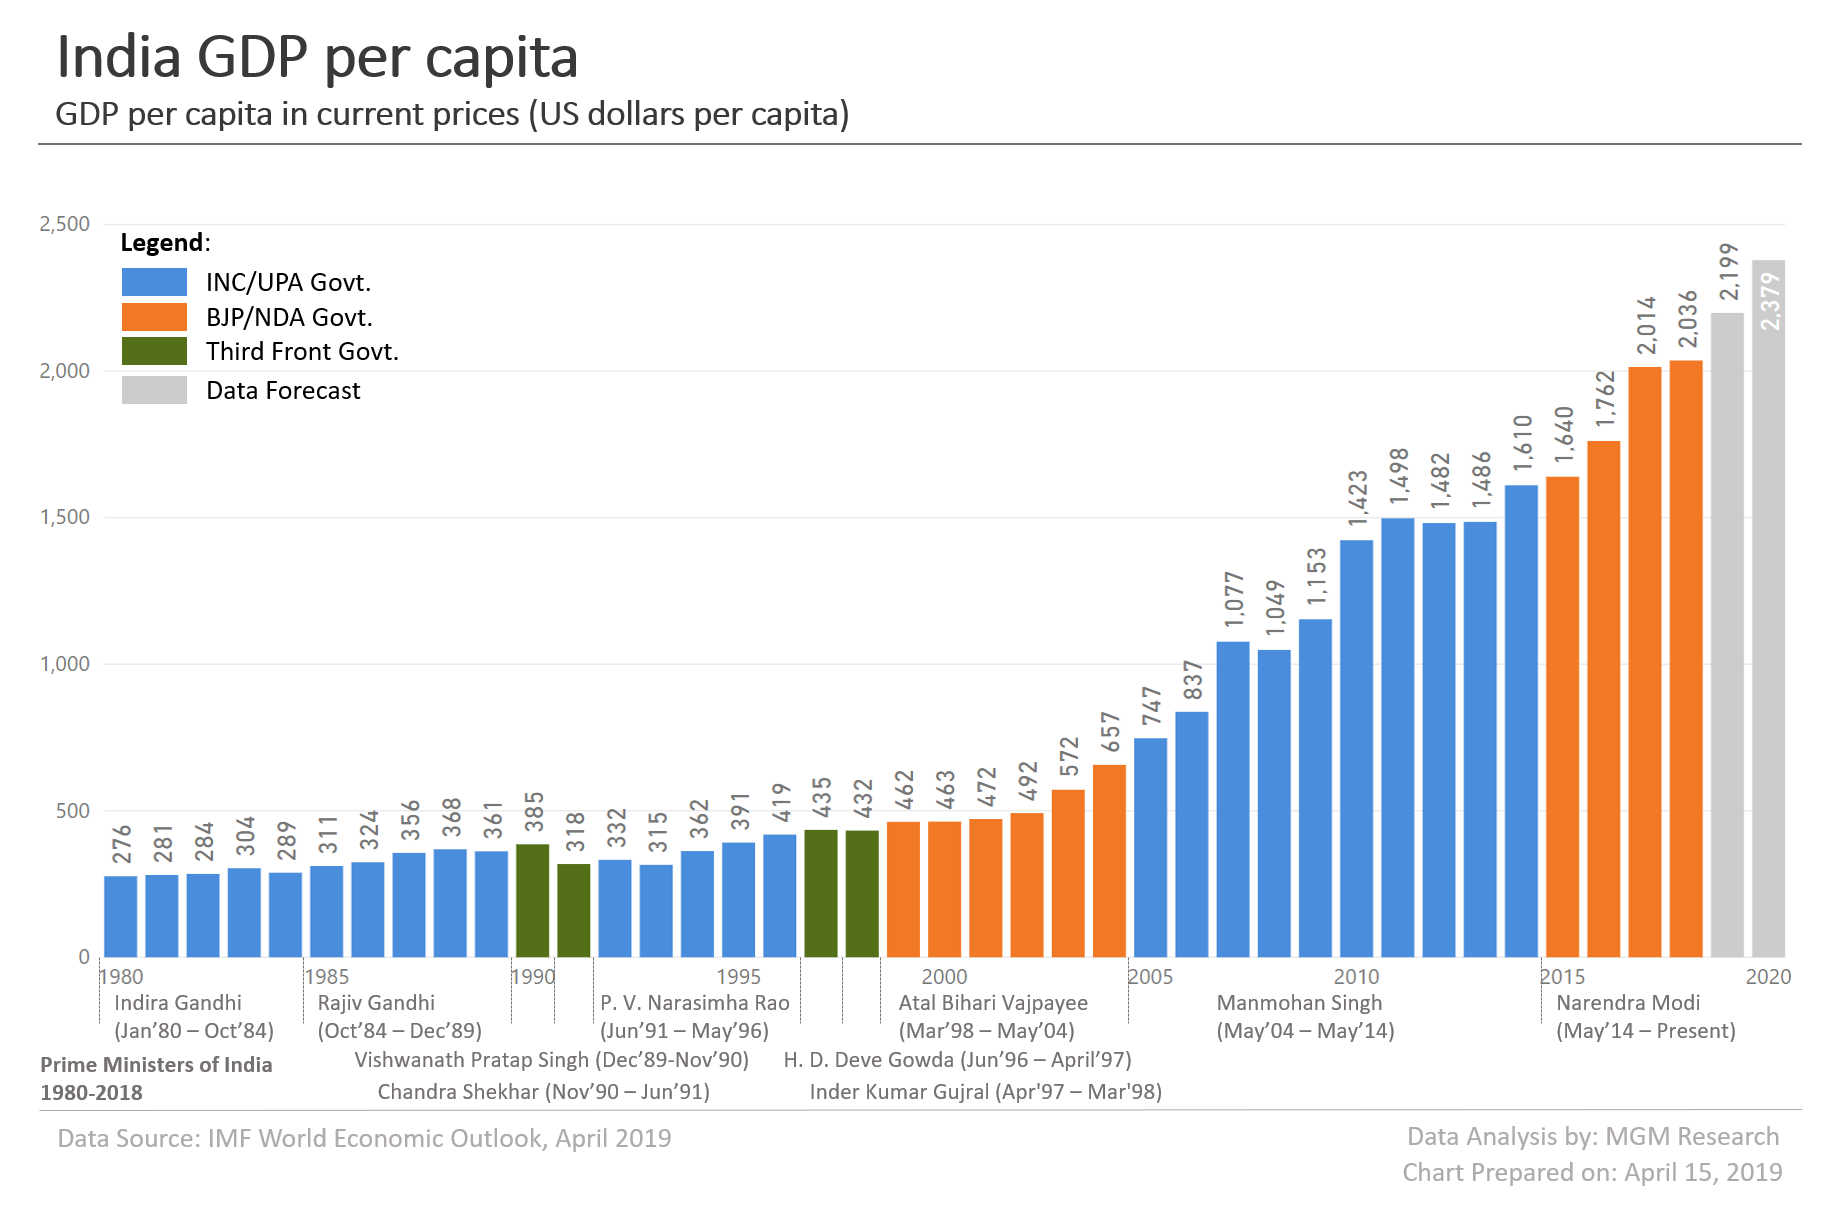
During 2018, India GDP per capita was $2,036. IMF estimates India GDP per capita to be $2,199 during 2019 and $2,379 during 2020. The chart below provides India GDP per capita data from 1980 to 2020.
India GDP PPP 1980-2020
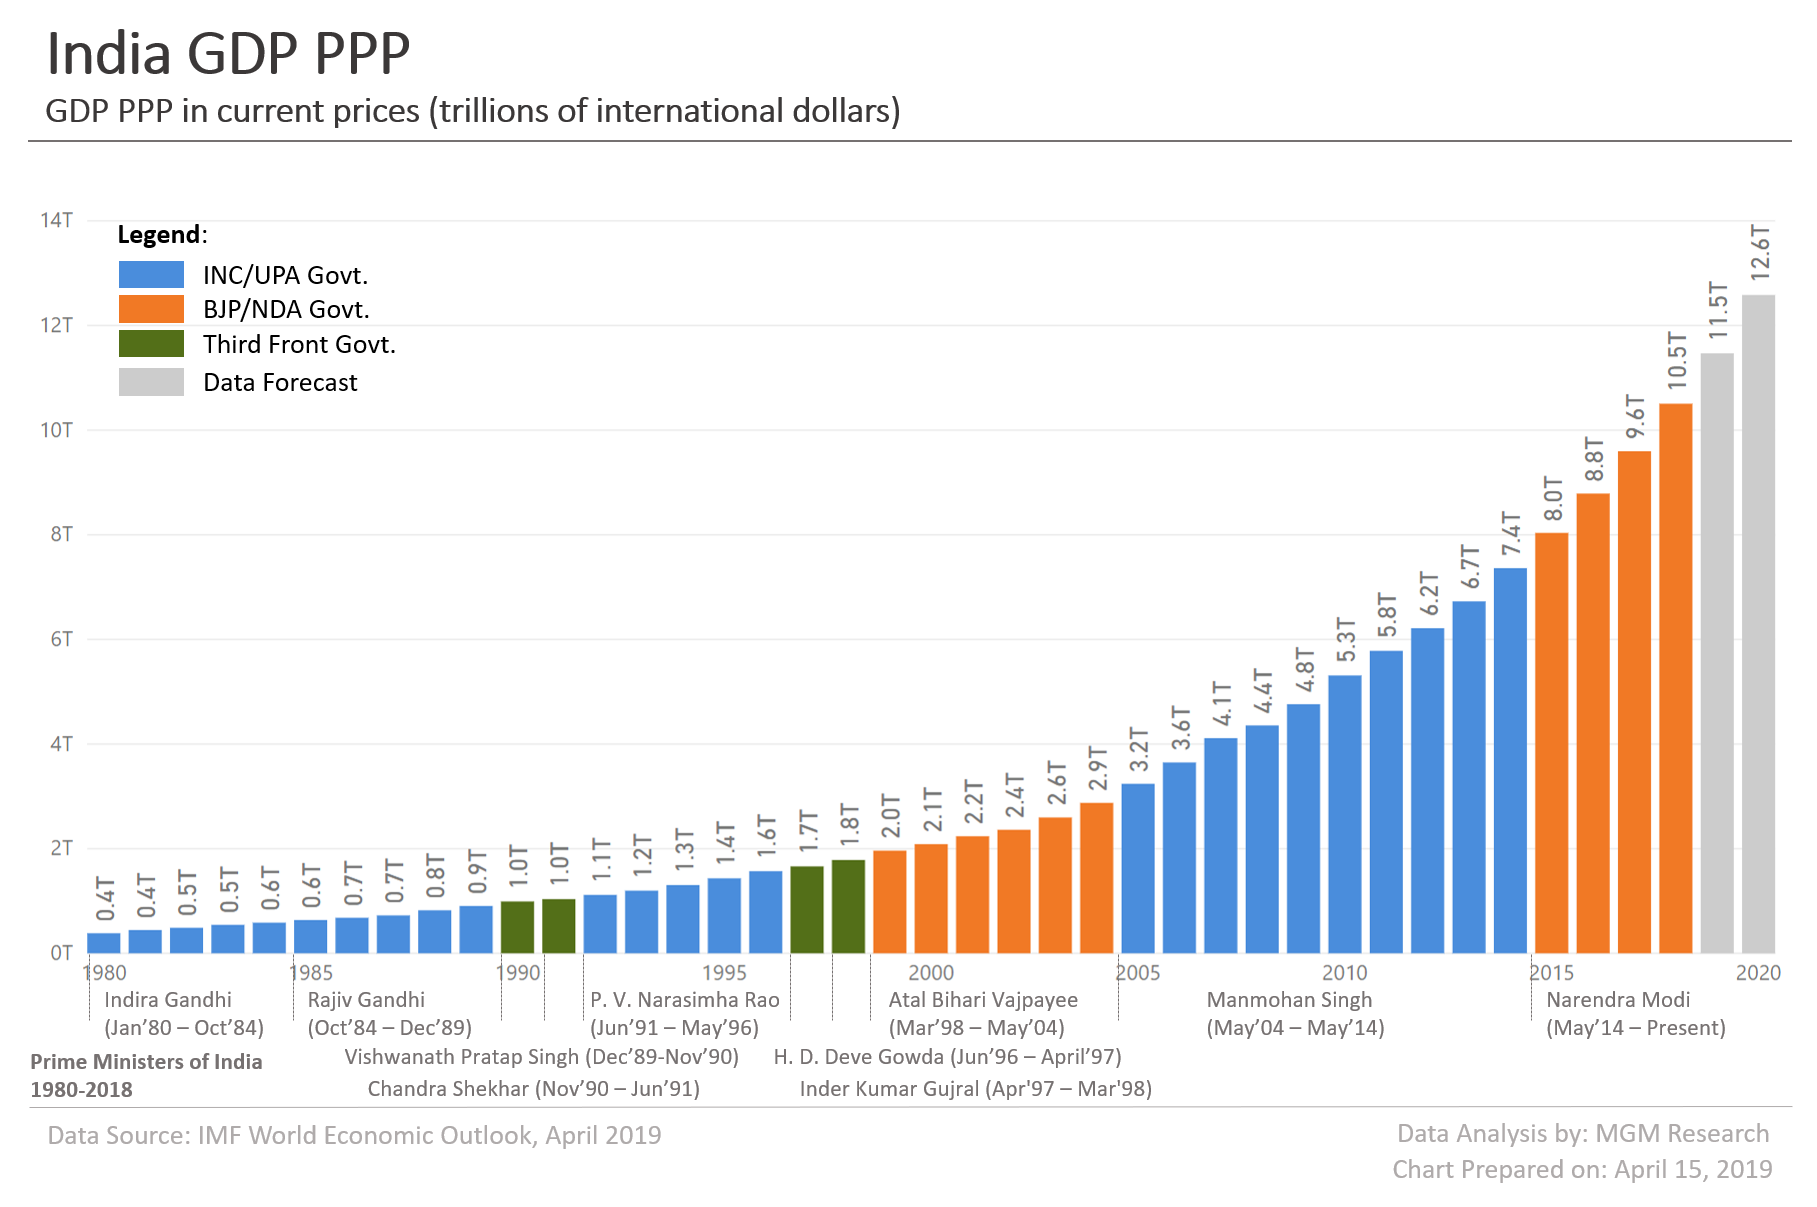
India GDP on a purchasing power parity basis (GDP PPP) reached $10.51 trillion during 2018. IMF estimates India GDP PPP to reach $11.49 trillion during 2019 and $12.58 trillion during 2020. The chart below provides India GDP PPP data from 1980 to 2020.
India GDP PPP per capita 1980-2020
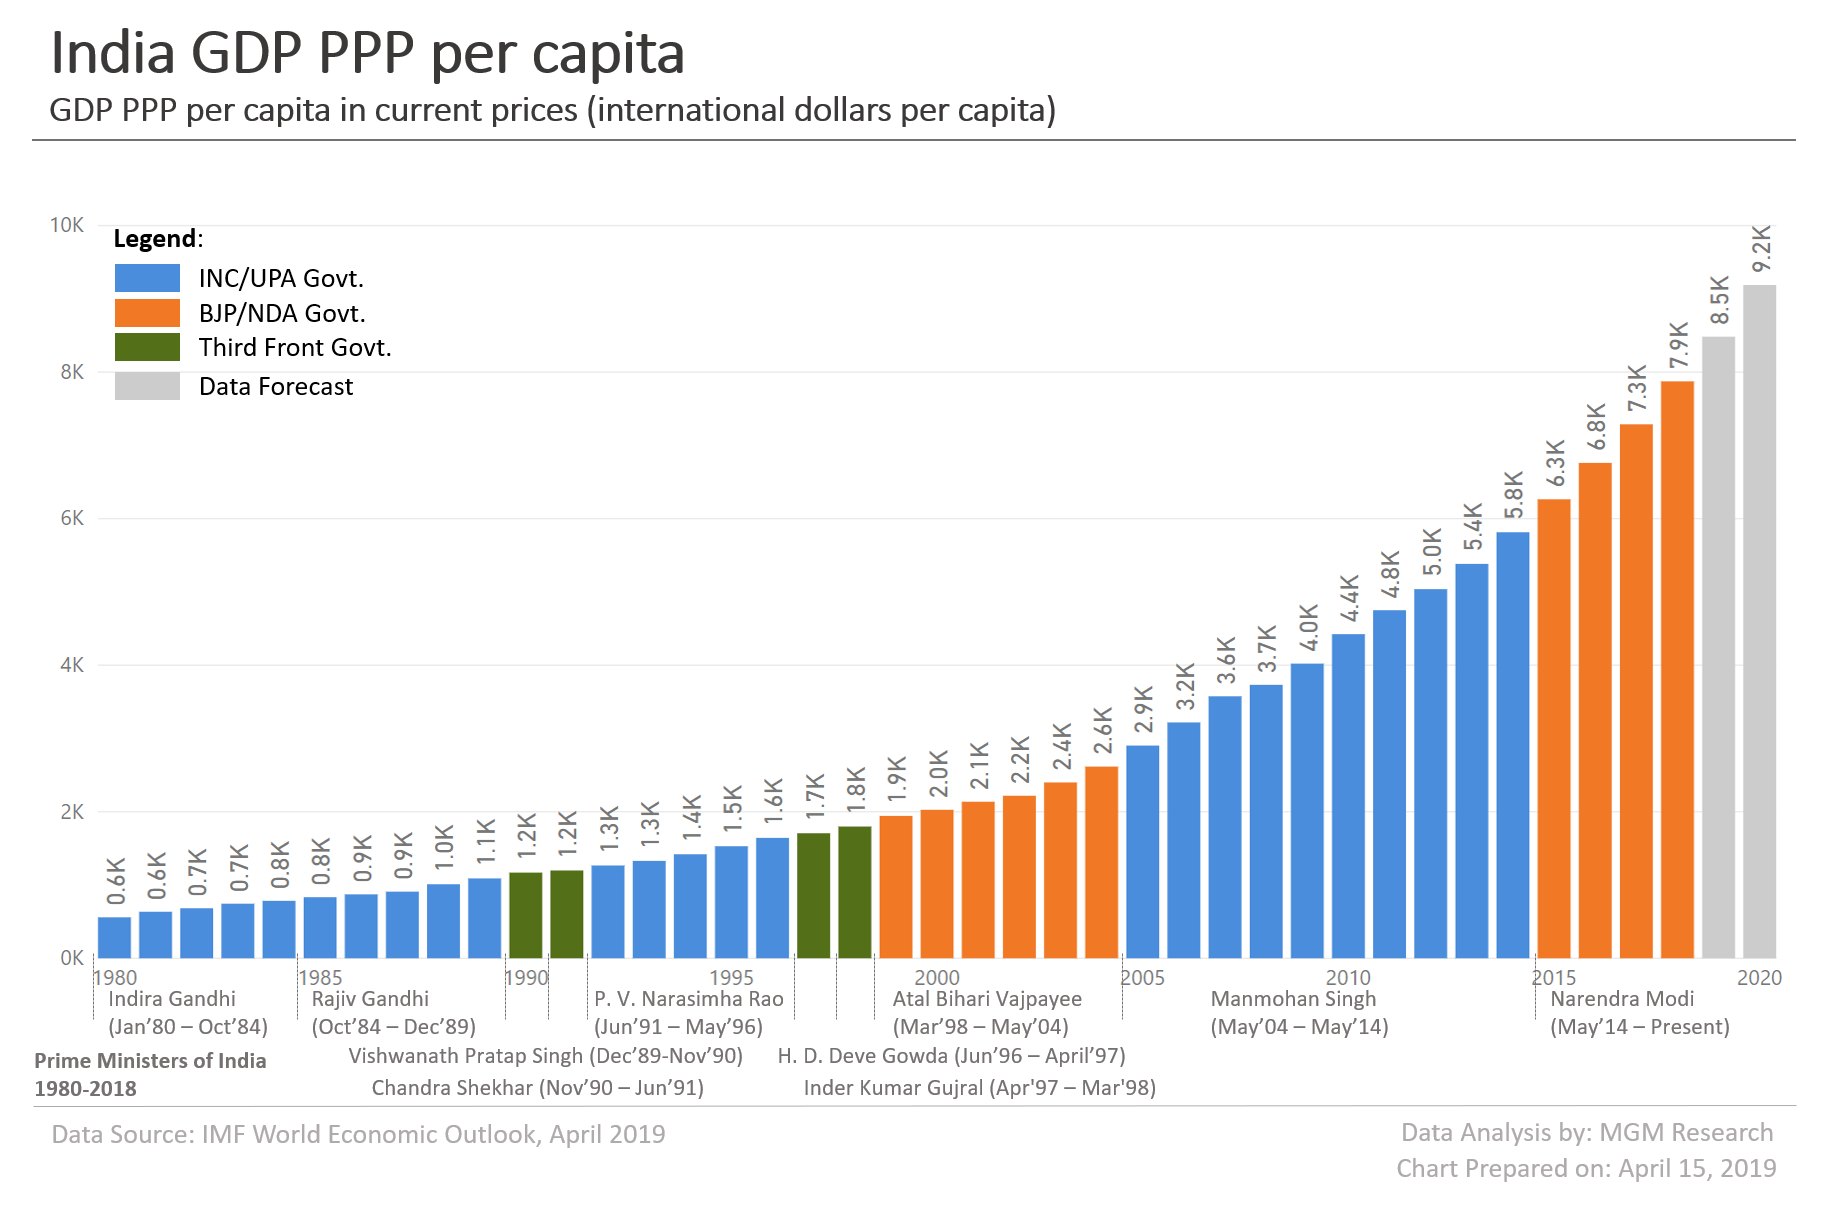
During 2018, India GDP per capita on a purchasing power parity basis (GDP PPP per capita) was $7,874. IMF estimates India GDP PPP per capita to be $8,484 during 2019 and $9,189 during 2020. The chart below provides India GDP PPP per capita data from 1980 to 2020.
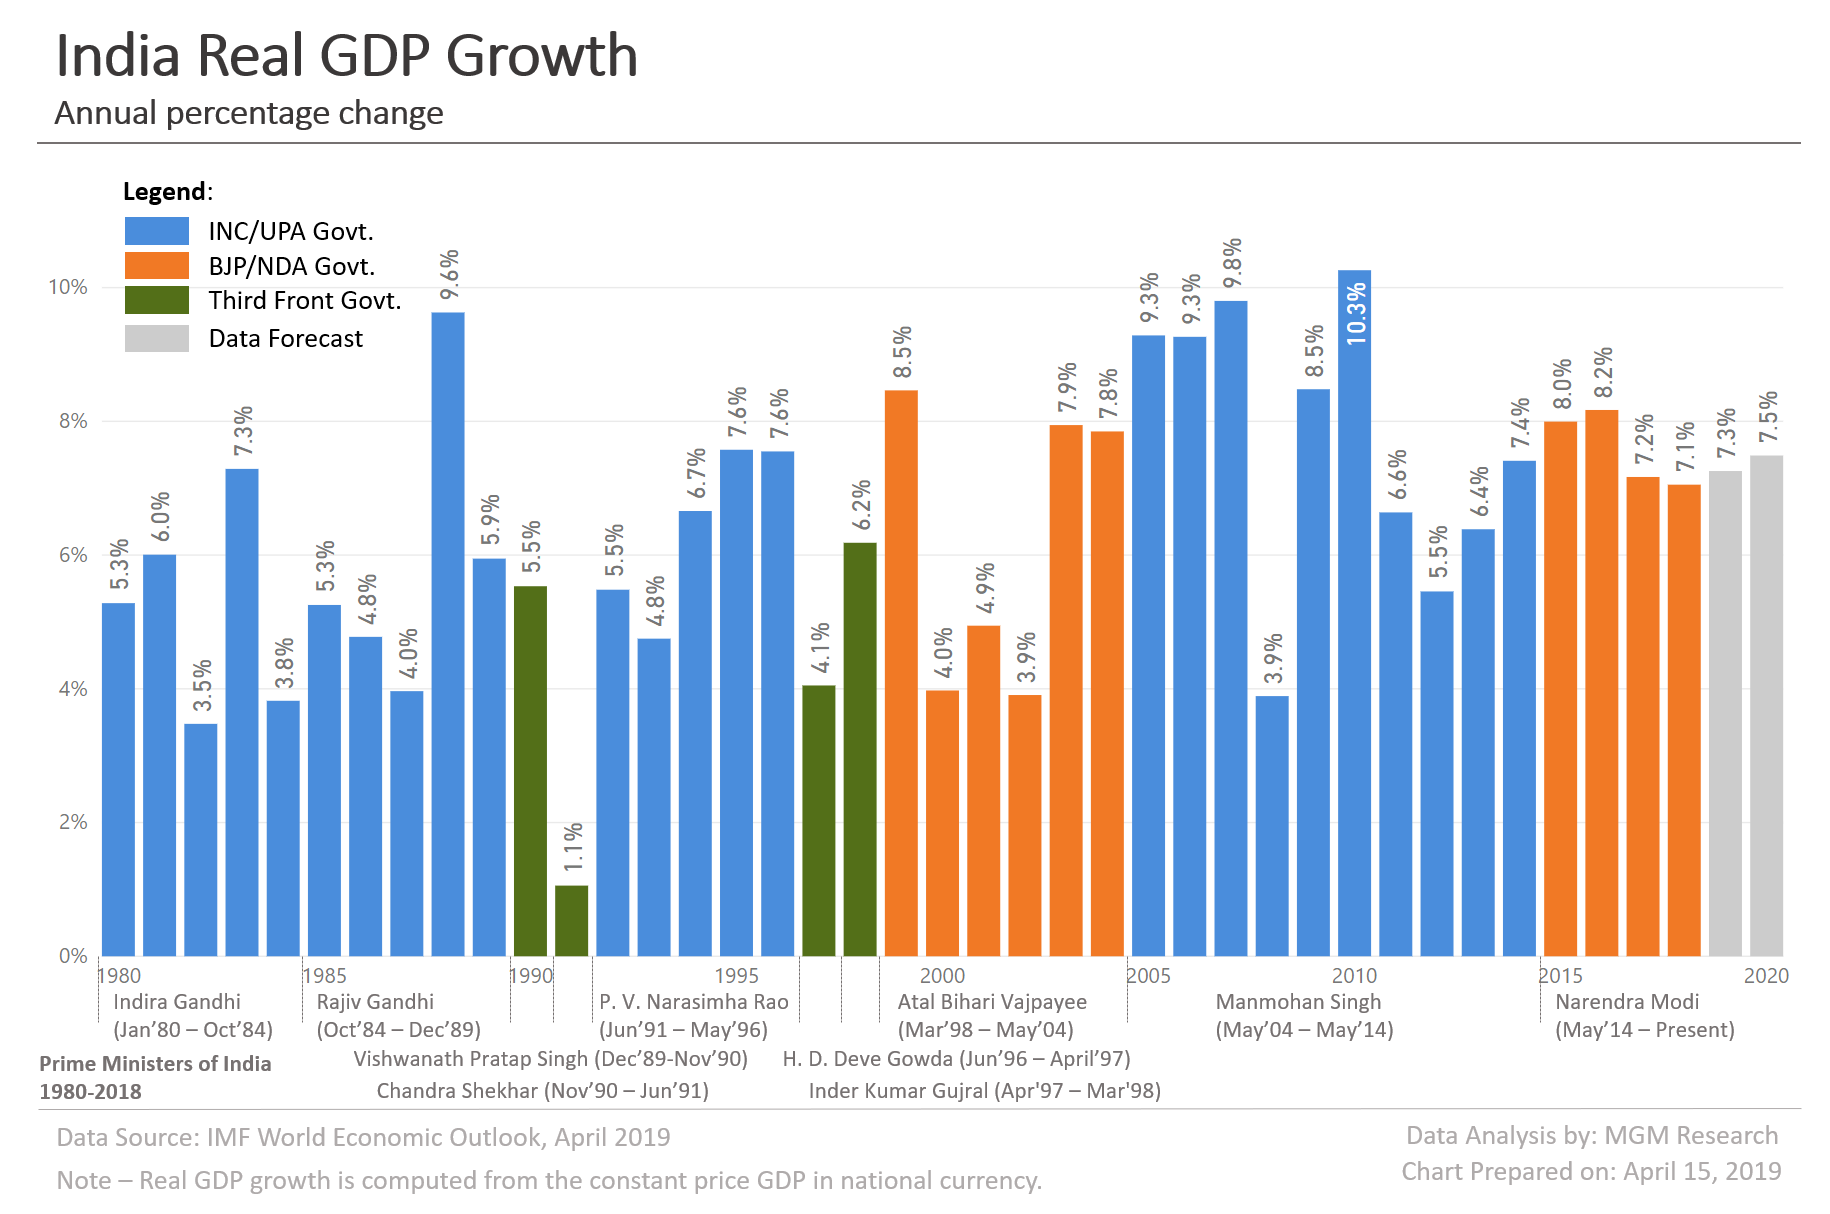
India Real GDP Growth 1980-2020
During 2018, India real GDP growth was 7.1%. IMF estimates India real GDP growth to be 7.3% during 2019 and 7.5% during 2020. The chart below provides India real GDP growth data from 1980 to 2020.
India GDP Data 1980-2020
The data table below provides the India GDP indicators related data from 1980 to 2020.
| Year | GDP ($bn) | GDP per capita ($) | GDP PPP ($bn) | GDP PPP per capita ($) | Real GDP Growth |
|---|---|---|---|---|---|
| 2020 | 3,258 | 2,379 | 12,584 | 9,189 | 7.5% |
| 2019 | 2,972 | 2,199 | 11,468 | 8,484 | 7.3% |
| 2018 | 2,717 | 2,036 | 10,505 | 7,874 | 7.1% |
| 2017 | 2,652 | 2,014 | 9,597 | 7,287 | 7.2% |
| 2016 | 2,290 | 1,762 | 8,788 | 6,761 | 8.2% |
| 2015 | 2,104 | 1,640 | 8,036 | 6,264 | 8.0% |
| 2014 | 2,039 | 1,610 | 7,363 | 5,814 | 7.4% |
| 2013 | 1,857 | 1,486 | 6,727 | 5,383 | 6.4% |
| 2012 | 1,828 | 1,482 | 6,214 | 5,038 | 5.5% |
| 2011 | 1,823 | 1,498 | 5,782 | 4,750 | 6.6% |
| 2010 | 1,708 | 1,423 | 5,311 | 4,424 | 10.3% |
| 2009 | 1,365 | 1,153 | 4,761 | 4,022 | 8.5% |
| 2008 | 1,224 | 1,049 | 4,356 | 3,732 | 3.9% |
| 2007 | 1,239 | 1,077 | 4,113 | 3,575 | 9.8% |
| 2006 | 949 | 837 | 3,648 | 3,219 | 9.3% |
| 2005 | 834 | 747 | 3,240 | 2,903 | 9.3% |
| 2004 | 722 | 657 | 2,876 | 2,616 | 7.8% |
| 2003 | 618 | 572 | 2,596 | 2,400 | 7.9% |
| 2002 | 524 | 492 | 2,361 | 2,218 | 3.9% |
| 2001 | 494 | 472 | 2,237 | 2,137 | 4.9% |
| 2000 | 477 | 463 | 2,086 | 2,026 | 4.0% |
| 1999 | 467 | 462 | 1,962 | 1,943 | 8.5% |
| 1998 | 429 | 432 | 1,784 | 1,798 | 6.2% |
| 1997 | 423 | 435 | 1,661 | 1,706 | 4.1% |
| 1996 | 400 | 419 | 1,569 | 1,643 | 7.6% |
| 1995 | 367 | 391 | 1,433 | 1,529 | 7.6% |
| 1994 | 333 | 362 | 1,305 | 1,420 | 6.7% |
| 1993 | 284 | 315 | 1,198 | 1,329 | 4.8% |
| 1992 | 293 | 332 | 1,117 | 1,266 | 5.5% |
| 1991 | 275 | 318 | 1,035 | 1,198 | 1.1% |
| 1990 | 327 | 385 | 991 | 1,169 | 5.5% |
| 1989 | 300 | 361 | 905 | 1,090 | 5.9% |
| 1988 | 300 | 368 | 822 | 1,010 | 9.6% |
| 1987 | 284 | 356 | 724 | 909 | 4.0% |
| 1986 | 253 | 324 | 680 | 872 | 4.8% |
| 1985 | 238 | 311 | 636 | 834 | 5.3% |
| 1984 | 216 | 289 | 586 | 784 | 3.8% |
| 1983 | 222 | 304 | 545 | 745 | 7.3% |
| 1982 | 204 | 284 | 488 | 683 | 3.5% |
| 1981 | 197 | 281 | 445 | 635 | 6.0% |
| 1980 | 189 | 276 | 383 | 559 | 5.3% |
Notes
Data Source: International Monetary Fund (IMF) World Economic Outlook (WEO) database, April 2019 edition.