In this article, we will share six charts showing the ranking of the G20 nations on the following indicators related to the Gross Domestic Product (GDP): Nominal GDP, Total Population, Nominal GDP per capita, GDP on a Purchasing Power Parity (PPP) basis, GDP PPP per capita, Real GDP Growth. We will present the International Monetary Fund (IMF) forecast for these GDP-related indicators for the year 2019.
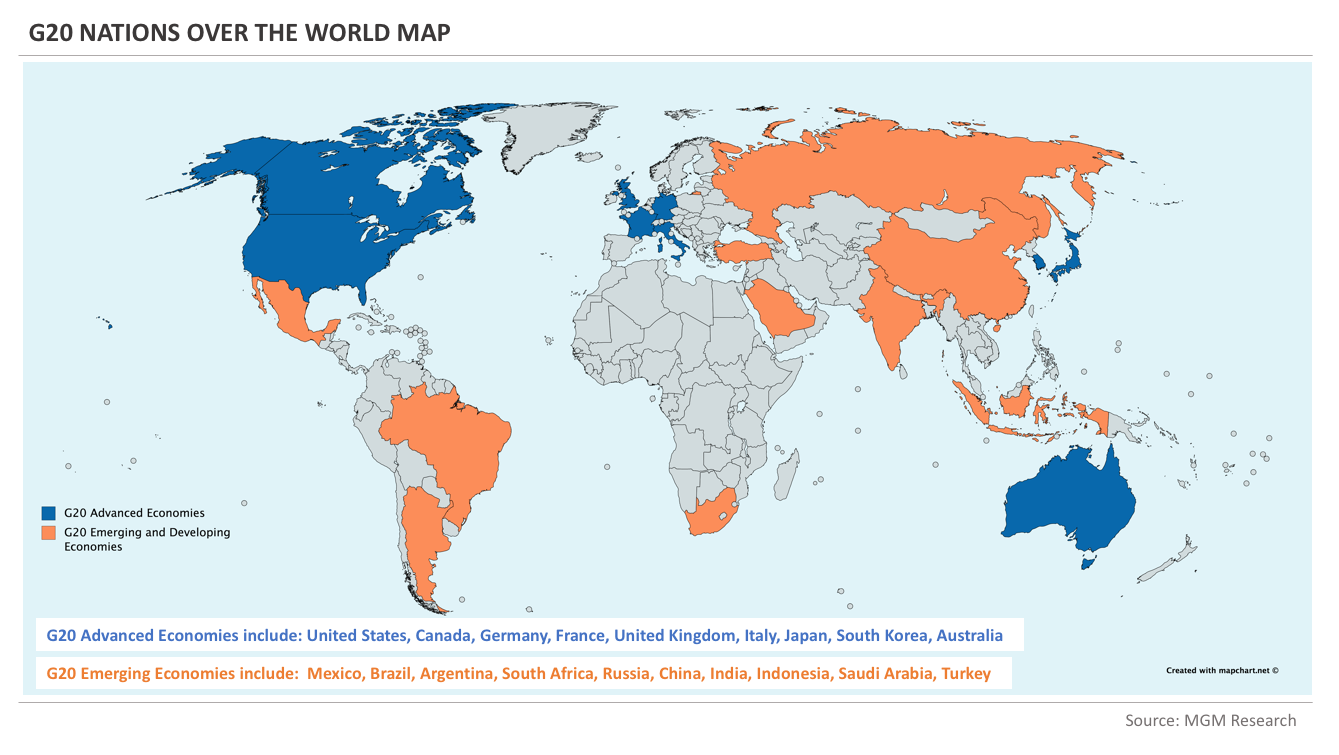
G20 Countries on the World Map
The Group of Twenty (G20) is a leading forum of the world’s major economies that seeks to develop policies to address the global challenges. The G20 is made up of 19 countries and the European Union (EU).
G20 includes the largest economies from the different continents. Here is a list of the G20 economies by the continent:
- North America - United States (US), Canada, Mexico
- South America - Brazil, Argentina
- Europe - Germany, France, United Kingdom (UK), Italy, Russia
- Asia - China, Japan, India, South Korea, Indonesia, Saudi Arabia, Turkey
- Africa - South Africa
- Oceania - Australia
IMF classifies the world into advanced and emerging and developing economies. IMF uses per capita income level as the main criterion for this classification. IMF also looks at the country’s export diversification and its degree of integration into the global financial system. So, the oil exporters that have high per capita GDP would not be classified as advanced economies because their 70% of exports are oil.
The advanced economies in the G20 include: United States, Canada, Germany, France, United Kingdom, Italy, Japan, South Korea, Australia
The emerging economies in the G20 include: Mexico, Brazil, Argentina, South Africa, Russia, China, India, Indonesia, Saudi Arabia, Turkey
In our article, we will share the data of 19 of the G20 countries. We will also share the aggregated numbers of the G20 advanced economies versus the G20 emerging economies. We will not share the data for the European Union, which is a political and economic union of 28 countries in the Europe continent.
The image below shows the location of the G20 countries on the world map.
G20 Nations Land Area
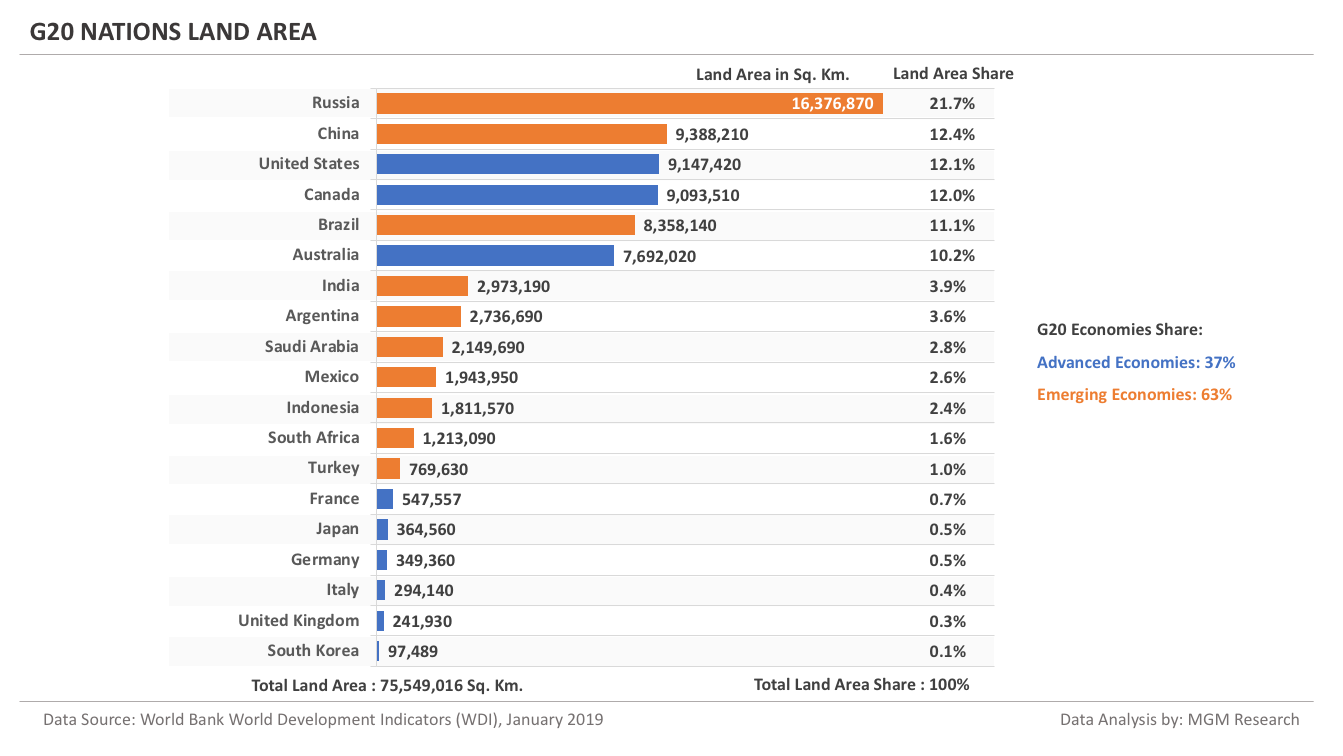
Before we present the data for GDP related indicators, let us take a quick look at the ranking of G20 nations by their land area. G20 nations have a total land area of about 76 million square kilometers. This is 59% of the world total land area of about 127 million square kilometers.
Russia share of the G20 nations total land area is about 22%. Russia is followed by China and the US with a land area share of about 12%.
The share of advanced economies in the G20 nations total land area is about 37%, whereas the G20 emerging economies have a total land area share of 63%.
The chart below provides a list of G20 countries ranked by their land area.
G20 Nations GDP - 2019 Forecast
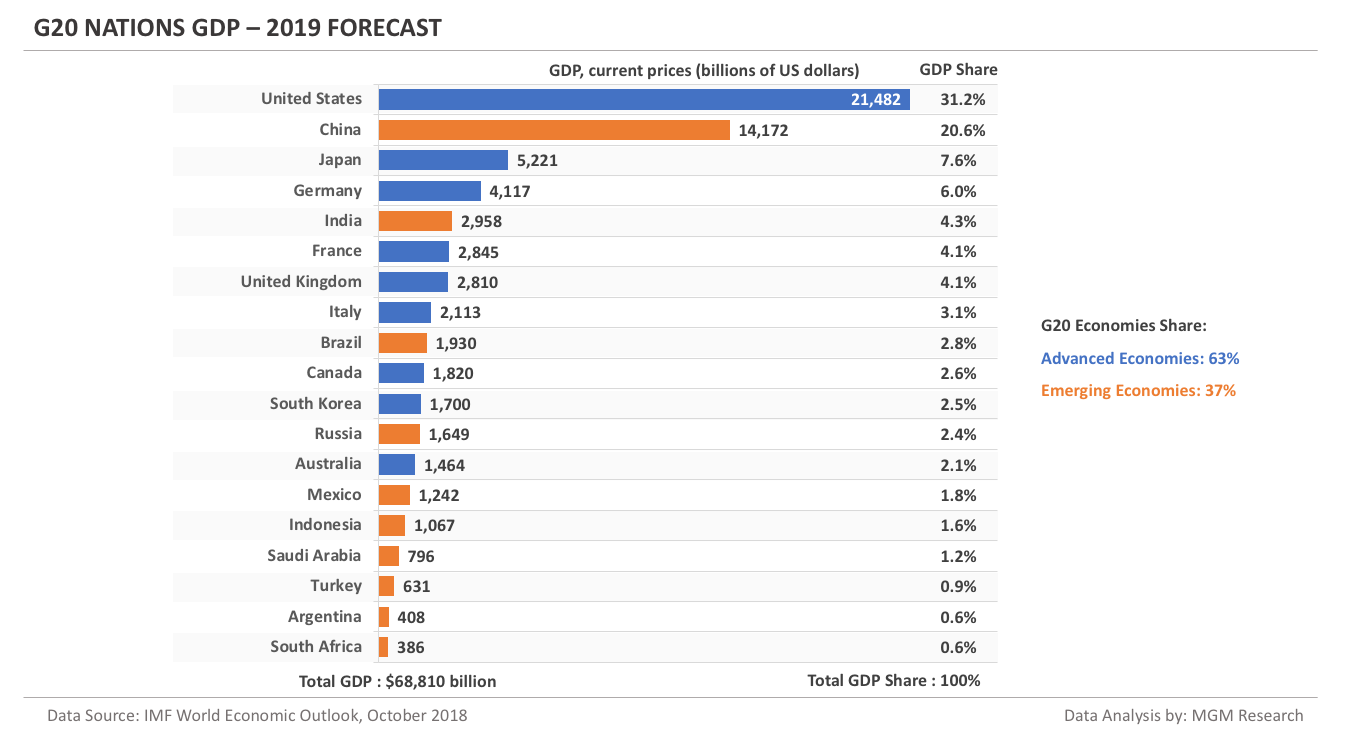
IMF forecasts G20 nations total GDP to reach nearly $69 trillion in 2019. This is 78% of the world total GDP of $88 trillion in 2019.
The US leads the G20 nations with a GDP share of about 31%. The US is followed by China and Japan with a GDP share of about 21% and 8% respectively. 15 of the G20 countries have a GDP of more than one trillion dollars.
The share of advanced economies in the G20 nations total GDP is about 63%, whereas the G20 emerging economies have a total GDP share of 37%.
The chart below provides a list of G20 countries ranked by their GDP in 2019.
G20 Nations Population - 2019 Forecast
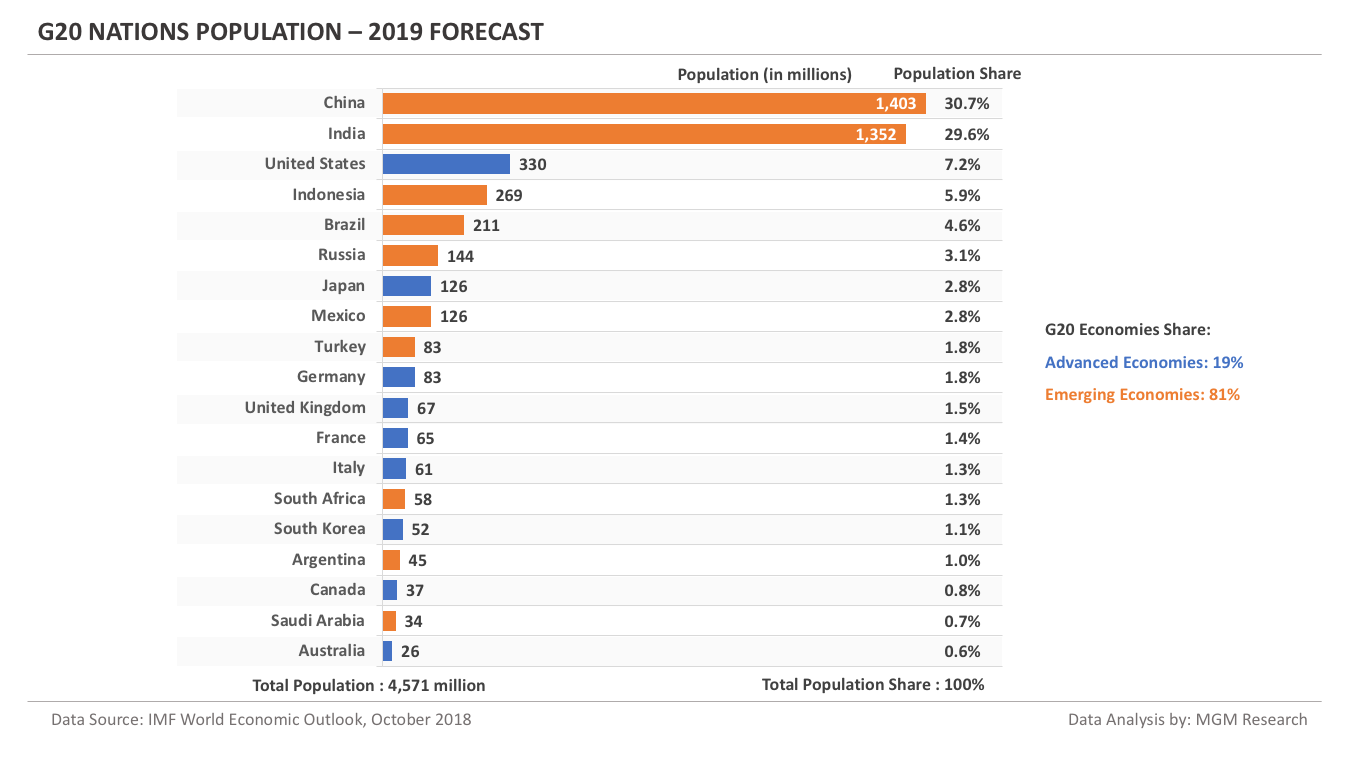
IMF forecasts G20 nations total population to reach 4.6 billion in 2019. This is 61% of the world total population of 7.5 billion in 2019.
China leads the G20 nations with a population share of about 31%, followed by India with a share of about 29%. So, China and India have a total population share of 60%. Eight of the G20 countries have a population of more than a hundred million.
The share of advanced economies in the G20 nations total population is about 19%, whereas the G20 emerging economies have a total population share of 81%.
The chart below provides a list of G20 countries ranked by their population in 2019.
G20 Nations GDP per capita - 2019 Forecast
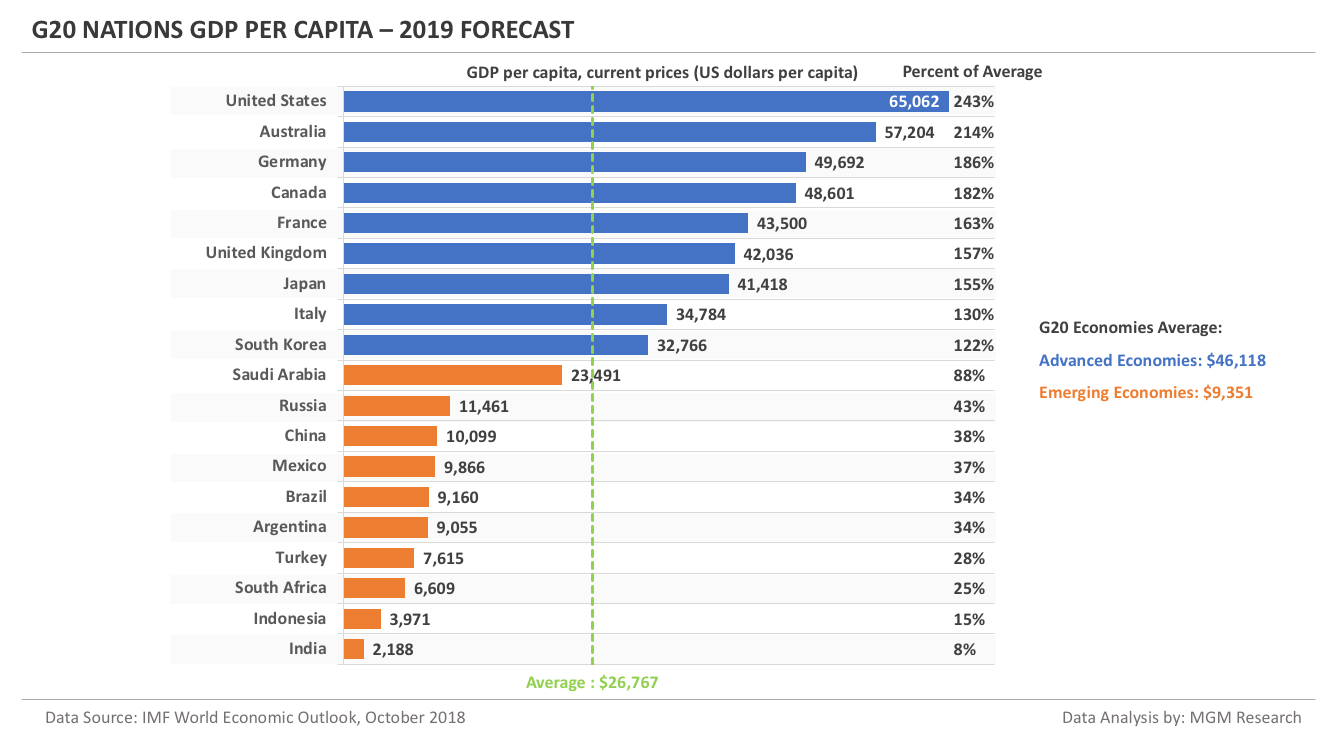
IMF forecasts G20 nations average GDP per capita to be $26,767 in 2019. All of the G20 advanced economies have a GDP per capita more than the average, whereas all of the G20 emerging and developing economies have a GDP per capita less than the average.
The US leads the G20 nations with a GDP per capita of $65,062. India ranks last with a GDP per capita of $2,188.
The G20 advanced economies have an average GDP per capita of $46,118, whereas the G20 emerging economies have an average GDP per capita of $9,351. So, the G20 advanced economies have an average GDP per capita five-times more than the G20 emerging economies.
The chart below provides a list of G20 countries ranked by their GDP per capita in 2019.
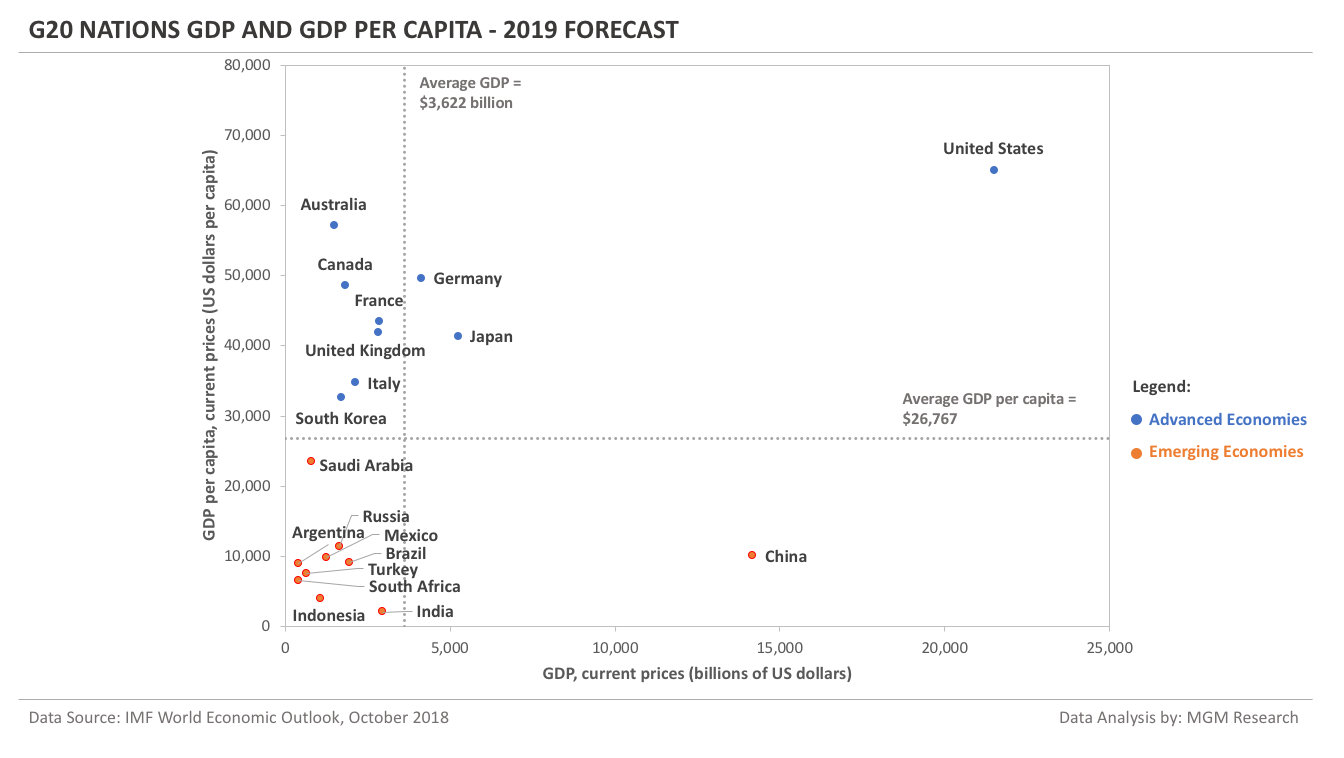
G20 Nations GDP and GDP per capita Matrix
The chart below positions the G20 countries on a GDP/GDP-PC Matrix chart. The GDP data is on x-axis and the GDP per capita (GDP-PC) data is on y-axis. All of the advanced economies are placed in the upper segment, whereas all of the emerging and developing economies are placed in the lower segment.
G20 Nations GDP PPP - 2019 Forecast
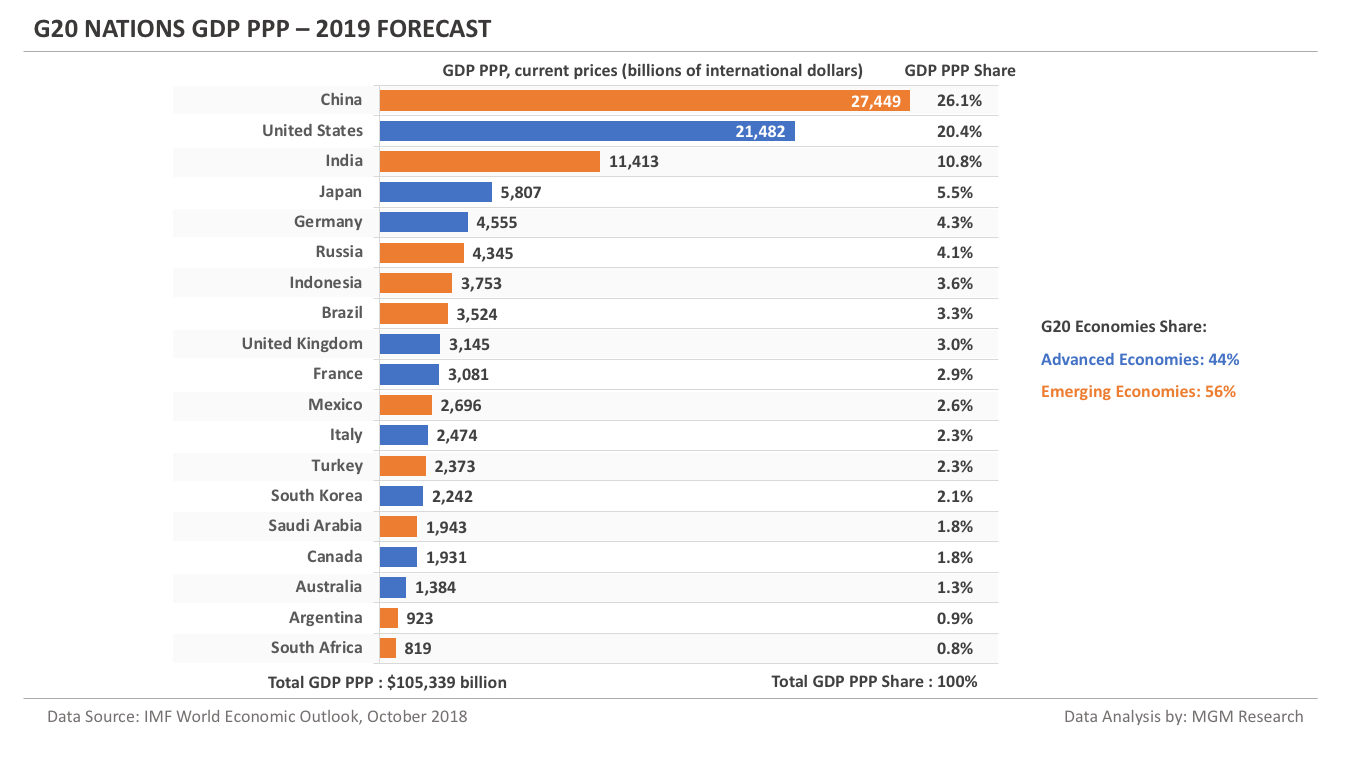
Now, let us compare G20 countries GDP on a Purchasing Power Parity (GDP PPP) basis. IMF forecasts G20 nations total GDP PPP to reach nearly $105 trillion in 2019. This is 74% of the world total GDP PPP of $143 trillion in 2019.
China leads the G20 nations with a GDP PPP share of about 26%. China is followed by the US and India with a GDP PPP share of about 20% and 11% respectively. 17 of the G20 countries have a GDP PPP of more than one trillion dollars.
The share of advanced economies in the G20 nations total GDP PPP is about 44%, whereas the G20 emerging economies have a total GDP PPP share of 56%.
The chart below provides a list of G20 countries ranked by their GDP PPP in 2019.
G20 Nations GDP PPP per capita - 2019 Forecast
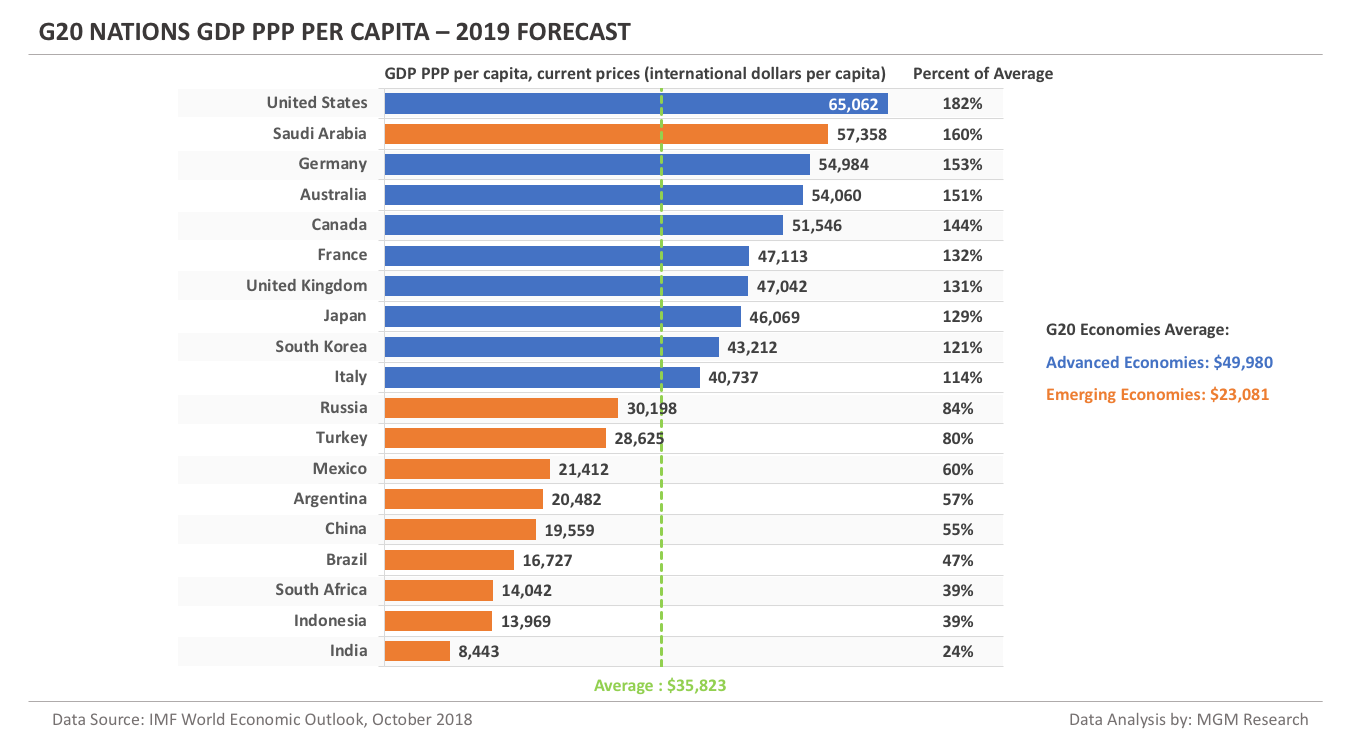
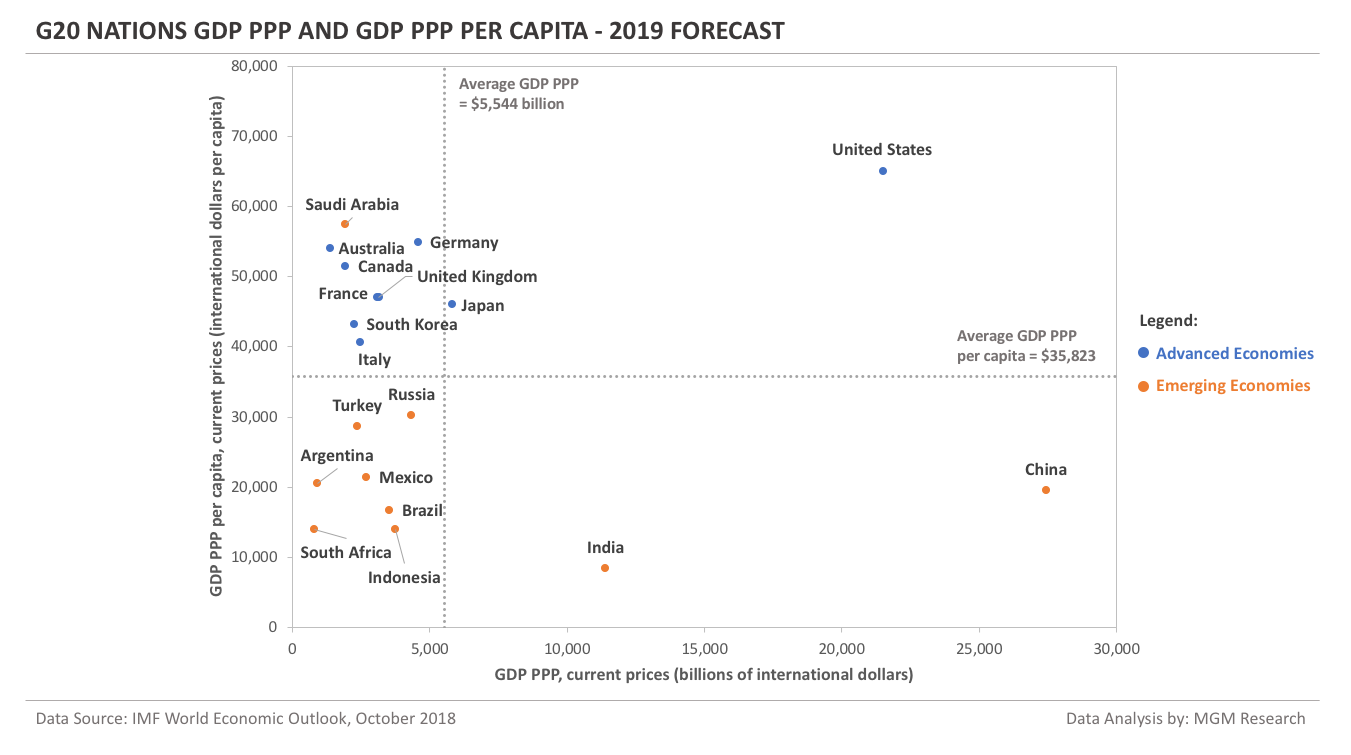
IMF forecasts G20 nations average GDP PPP per capita to be $35,823 in 2019. All of the G20 advanced economies have a GDP PPP per capita more than the average. All of the G20 emerging and developing economies, except Saudi Arabia, have a GDP PPP per capita less than the average.
The US leads the G20 nations with a GDP PPP per capita of $65,062. India ranks last with a GDP PPP per capita of $8,443.
The G20 advanced economies have an average GDP PPP per capita of $49,980, whereas the G20 emerging economies have an average GDP PPP per capita of $23,081. So, the G20 advanced economies have an average GDP PPP per capita 2.2-times more than the G20 emerging economies.
The chart below provides a list of G20 countries ranked by their GDP PPP per capita in 2019.
G20 Nations GDP PPP and GDP PPP per capita Matrix
The chart below positions the G20 countries on a GDP-PPP/GDP-PPP-PC Matrix chart. The GDP PPP data is on x-axis and the GDP PPP per capita data is on y-axis.
G20 Nations Real GDP Growth - 2019 Forecast
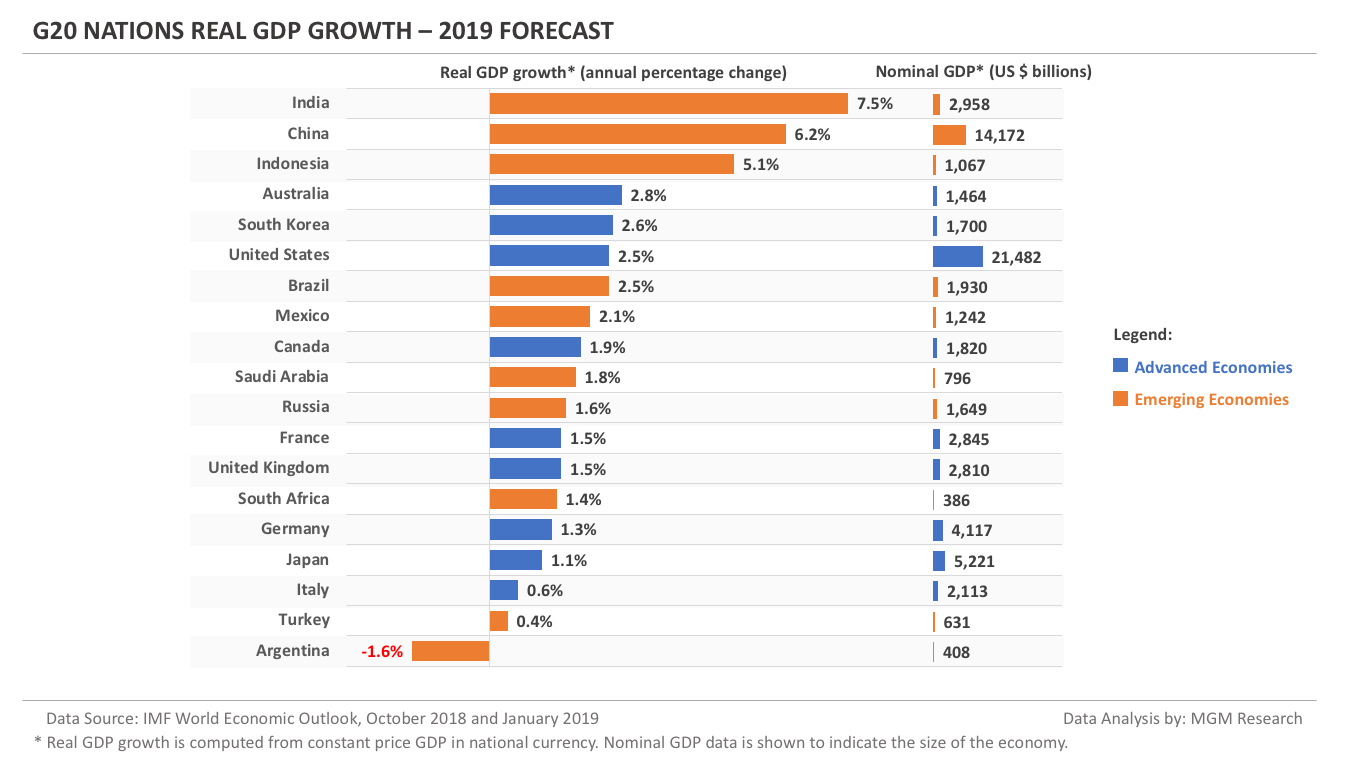
The chart below provides a list of G20 countries ranked by the real GDP growth in 2019. Real GDP growth is computed from constant price GDP in national currency. Nominal GDP data is shown to indicate the size of the economy. Generally, smaller economies have high growth rates. Bigger economies have lower growth rates because of a larger base.
Notes
1. Data Source: International Monetary Fund (IMF) World Economic Outlook (WEO) database, October 2018 edition.
Related Articles
2. G20 Countries GDP Comparison 2004-2023 - In this article, we compare the GDP of G20 nations for the 20-year period from 2004 to 2023. We analyze which nations have done better than the others during the last 10 years, since the global recession in 2008.
Â
i like the way your information was presented