On December 18, 2018, China completed 40 years since it started its economic reforms in 1978. China has come a long way since then. China is now the number two economy in the World, just behind the United States (US). In this article, we will compare the China Gross Domestic Product (GDP) numbers with that of the US over the 40-year period. We will use the publicly available data from IMF (See notes at the bottom). Our analysis starts from 1980 and goes up a little into the future to 2020. The data from 2018 to 2020 are the forecasts by IMF.
China vs US - Comparing GDP
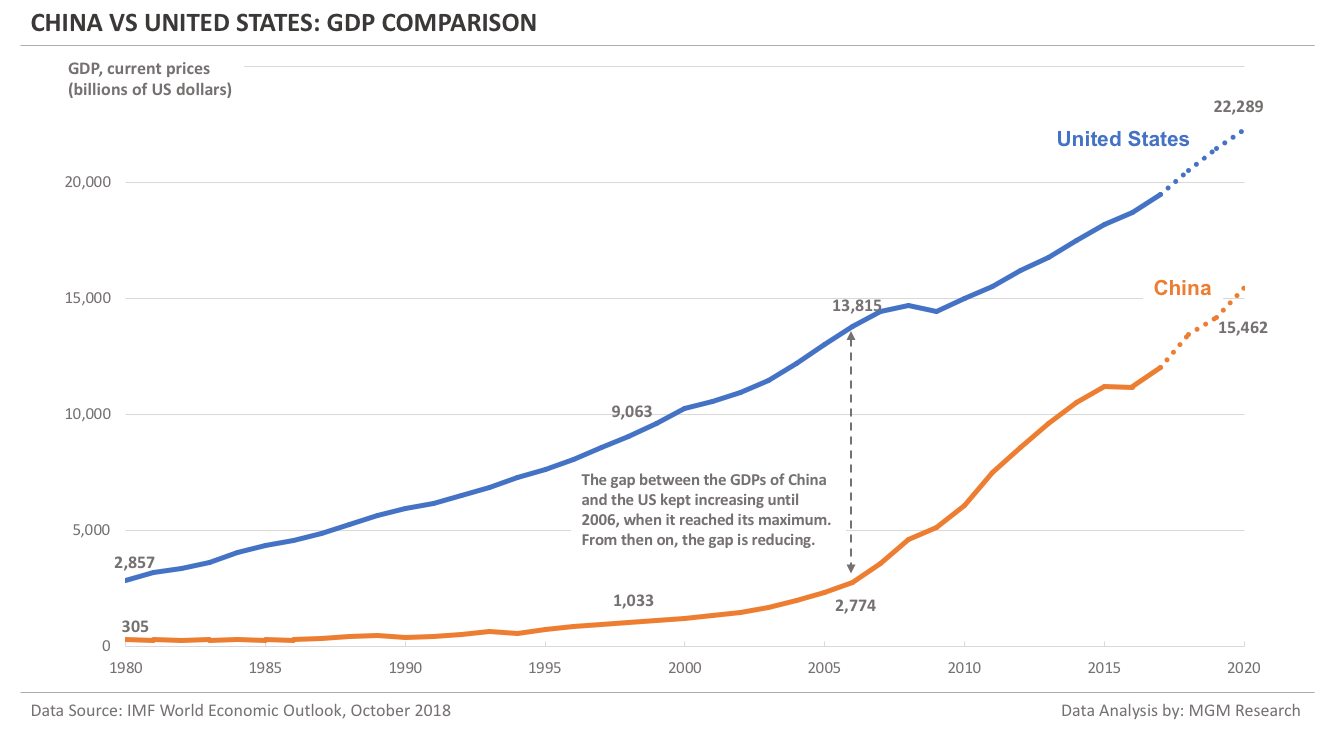
During 1980, China GDP was $305 billion, whereas the US GDP was $2.8 trillion. China GDP reached $1.0 trillion by 1998. At that time, the US GDP reached $9.1 trillion.
The gap between the US and China GDP kept increasing until 2006, when it reached its maximum. From then on, the gap has been reducing because China is having more incremental GDP than the US every year.
Incremental GDP is the difference between the GDP numbers between any two years.
At the end of 2006, China GDP was $2.8 trillion and the US GDP was $13.8 trillion. During the 26 years (1980-2006), China incremental GDP was $2.5 trillion, whereas the US incremental GDP was $11 trillion (As an Incremental GDP calculation example, subtract China GDP of $305 billion in 1980 from its GDP of $2.8 trillion in 2006 to get an incremental GDP of $2.5 trillion). So, the US had over 4-times more incremental GDP than China during the 26 years from 1980 to 2006.
By the end of 2020, IMF forecasts that China GDP will reach $15.5 trillion, whereas the US GDP will reach $22.3 trillion. This implies an incremental GDP of $12.7 trillion for China and an incremental GDP of $8.5 trillion for the US, during the 14 years from 2006 to 2020.
China vs US - Comparing GDP per capita
Before comparing GDP per capita, we will compare the population of China and the US.
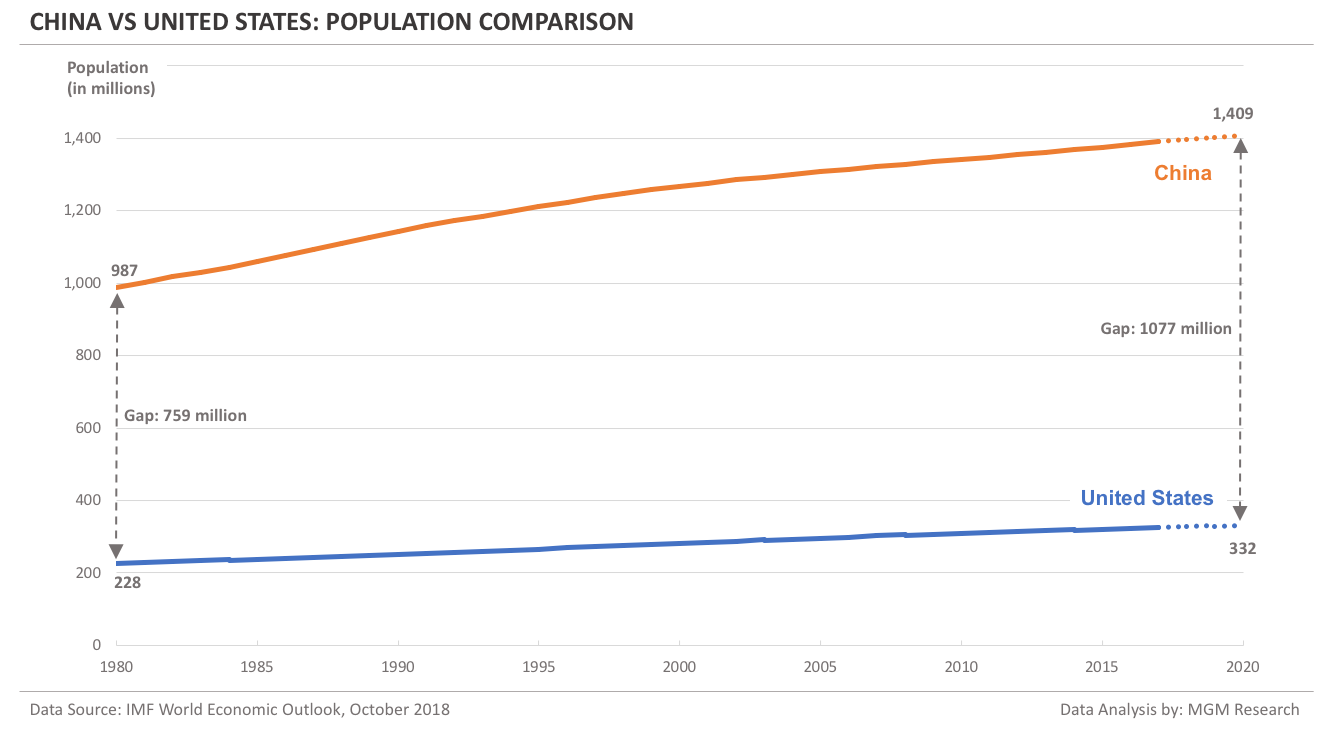
China had a total population of 987 million during 1980. The US population during 1980 was 228 million.
China had over 4-times more population than that of the US in 1980. This multiple will remain nearly the same in 2020 as well.
IMF forecasts China population to reach 1.4 billion by 2020, whereas the US population would reach 332 million. This implies a net increase of 422 million in the China population and 104 million in the US population, during the 40-year period, from 1980 to 2020.
The gap between the China and the US population will grow from 759 million in 1980 to 1077 million in 2020.
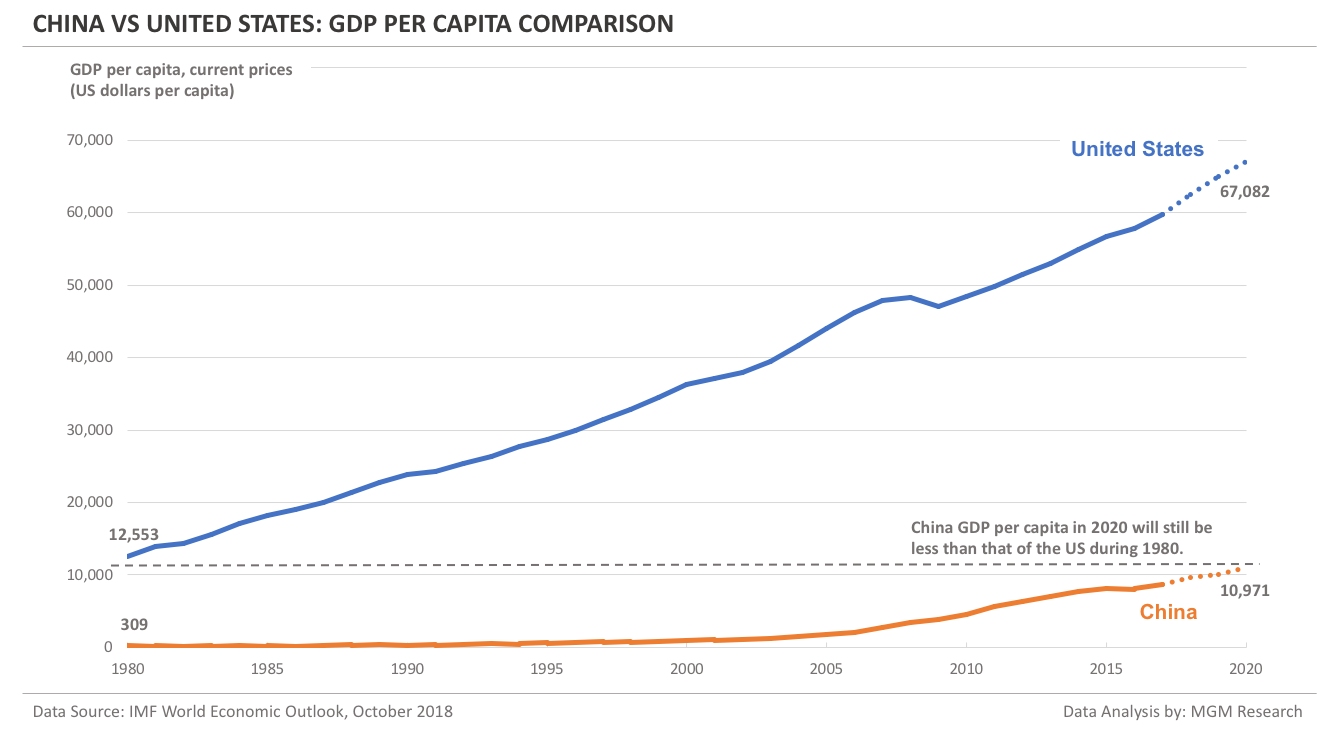
China GDP per capita during 1980 was $309 (When we divide the China GDP of $305 billion in 1980 with the China population of 987 million in 1980, we will get the GDP per capita as $309.) At that time, the US GDP per capita was $12,553. So, the US GDP per capita was 41-times more than that of China.
IMF forecasts China GDP per capita to reach $10,971 in 2020. This will still be less than that of the US GDP per capita in 1980, which was $12,553.
In GDP per capita terms, China is nearly 40 years behind the US.
China vs US - Comparing GDP PPP
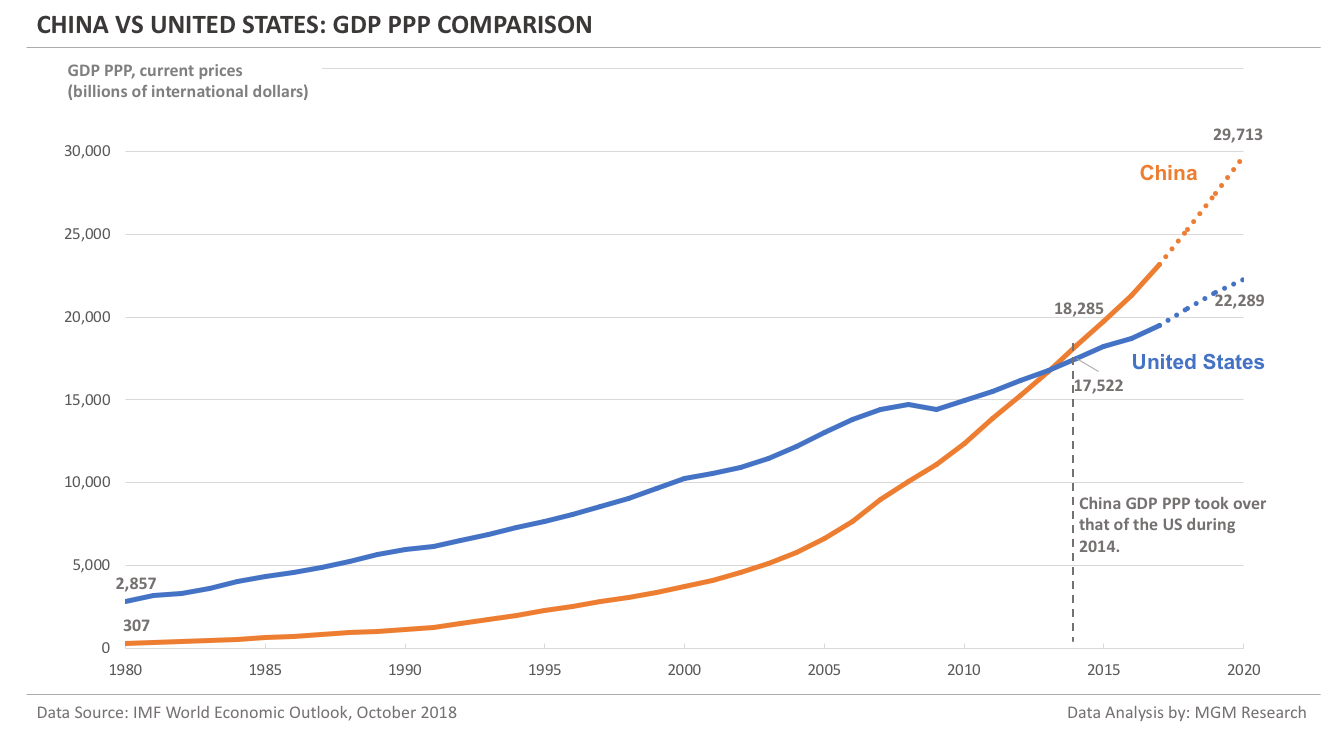
If we compare GDP on a Purchasing Power Parity (PPP) basis, China a bigger economy than the US. China GDP PPP took over that of the US during 2014.
China GDP PPP reached $18.3 trillion in 2014, whereas US GDP PPP was $17.5 trillion at that time. IMF forecasts that the China GDP PPP will reach $29.7 trillion by 2020.
China vs US - Comparing GDP PPP per capita
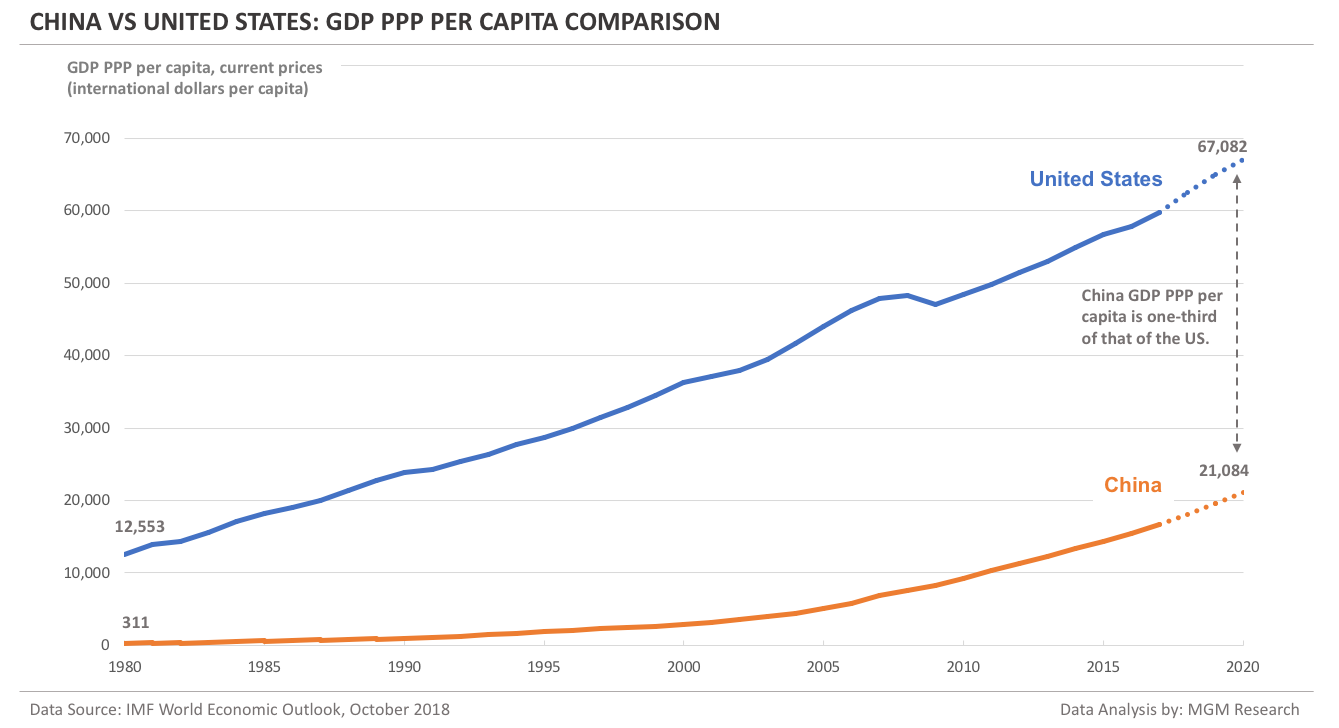
China GDP PPP per capita numbers look little better than its GDP per capita numbers. IMF forecasts that China GDP PPP per capita would reach $21,084 by 2020. This is nearly double than that of China GDP per capita of $10,971 in 2020, which we saw earlier in this article.
Even though China is ahead of US in GDP PPP, China GDP PPP per capita is still one-third of that of the US.
China vs US - Comparing real GDP growth
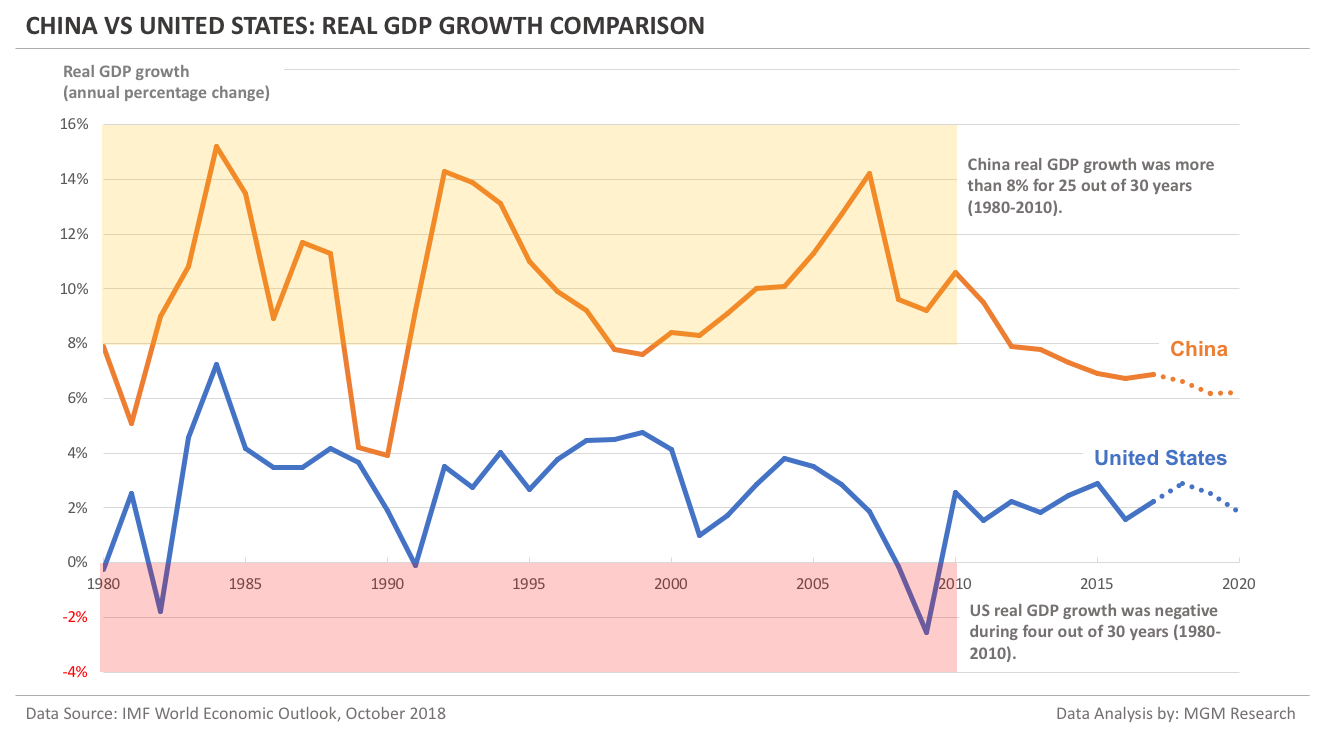
China had a strong real GDP growth (the one computed from the GDP reported in China national currency) from 1980 to 2010. This is because China was growing on a smaller base.
China real GDP growth was more than 8% for 25 out of 30 years, during 1980 to 2010. As the base is increasing, the growth numbers are slowing down. Still, China real GDP is growing more than 6% per year.
The US real GDP growth numbers had been little lower than that of China. Despite a lower growth, the US was adding more incremental GDP than China every year until 2006. How do you explain this? We think this is due to the fact that the US has been growing on a much higher base. So, even though China was growing faster than the US, the GDP gap between two countries kept increasing (as we have seen earlier in this article). Another factor that contributed to the increase in the GDP gap was currency conversion.
China vs US - GDP and GDP per capita growth summary
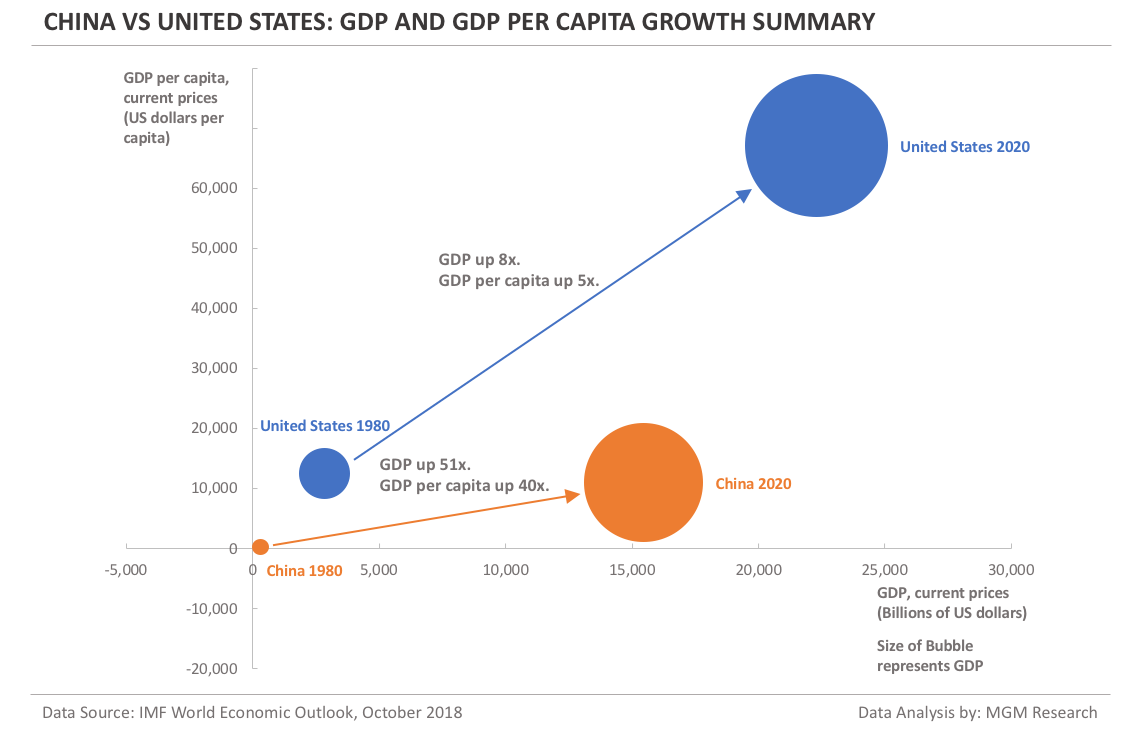
China GDP during 1980 was $305 billion and GDP per capita was $309. IMF forecasts China GDP to reach $15,462 billion and GDP per capita to reach $10,971 by 2020.
This implies an increase of 51-times in China GDP and 36-times in China GDP per capita during the 40-year period from 1980 to 2020.
The US GDP during 1980 was $2,857 billion and GDP per capita was $12,553. IMF forecasts the US GDP to reach $22,289 billion and GDP per capita to reach $67,082 by 2020.
This implies an increase of 8-times in the US GDP and 5-times in the US GDP per capita during the 40-year period from 1980 to 2020.
Notes
1. Data Source: International Monetary Fund (IMF) World Economic Outlook (WEO) database, October 2018 edition.
Related Articles
1. US GDP Data and Charts 1980-2020