In this article, we will share the charts and data for the Gross Domestic Product (GDP) related indicators of Canada. We will provide the charts and data for Canada’s Nominal GDP, Nominal GDP per capita, GDP on a Purchasing Power Parity (PPP) basis, GDP PPP per capita, and Real GDP Growth. We will present the charts and data for these indicators during the 40-year period from 1980 to 2020. We have used the publicly available data from International Monetary Fund (IMF). The data for 2019 and 2020 are estimates by IMF staff.
In the charts, we have added information about the prime minister of Canada leading the government during the different time periods. This can help us relate the GDP indicator data during a particular time period with the prime minister of Canada leading the government. The table below provides information on the prime ministers of Canada from 1980 to 2018 and their term of office.
Prime Ministers of Canada 1980-2020
| Name | Party | Office Term Start | Office Term End |
|---|---|---|---|
| Pierre Trudeau | Liberal Party | Mar-1980 | Jun-1984 |
| John Turner | Liberal Party | Jun-1984 | Sep-1984 |
| Brian Mulroney | Progressive Conservative Party | Sep-1984 | Jun-1993 |
| Kim Campbell | Progressive Conservative Party | Jun-1993 | Nov-1993 |
| Jean Chrétien | Liberal Party | Nov-1993 | Dec-2003 |
| Paul Martin | Liberal Party | Dec-2003 | Feb-2006 |
| Stephen Harper | Conservative Party | Feb-2006 | Nov-2015 |
| Justin Trudeau | Liberal Party | Nov-2015 | Incumbent |
Source: Wikipedia (https://en.wikipedia.org/wiki/List_of_Prime_Ministers_of_Canada)
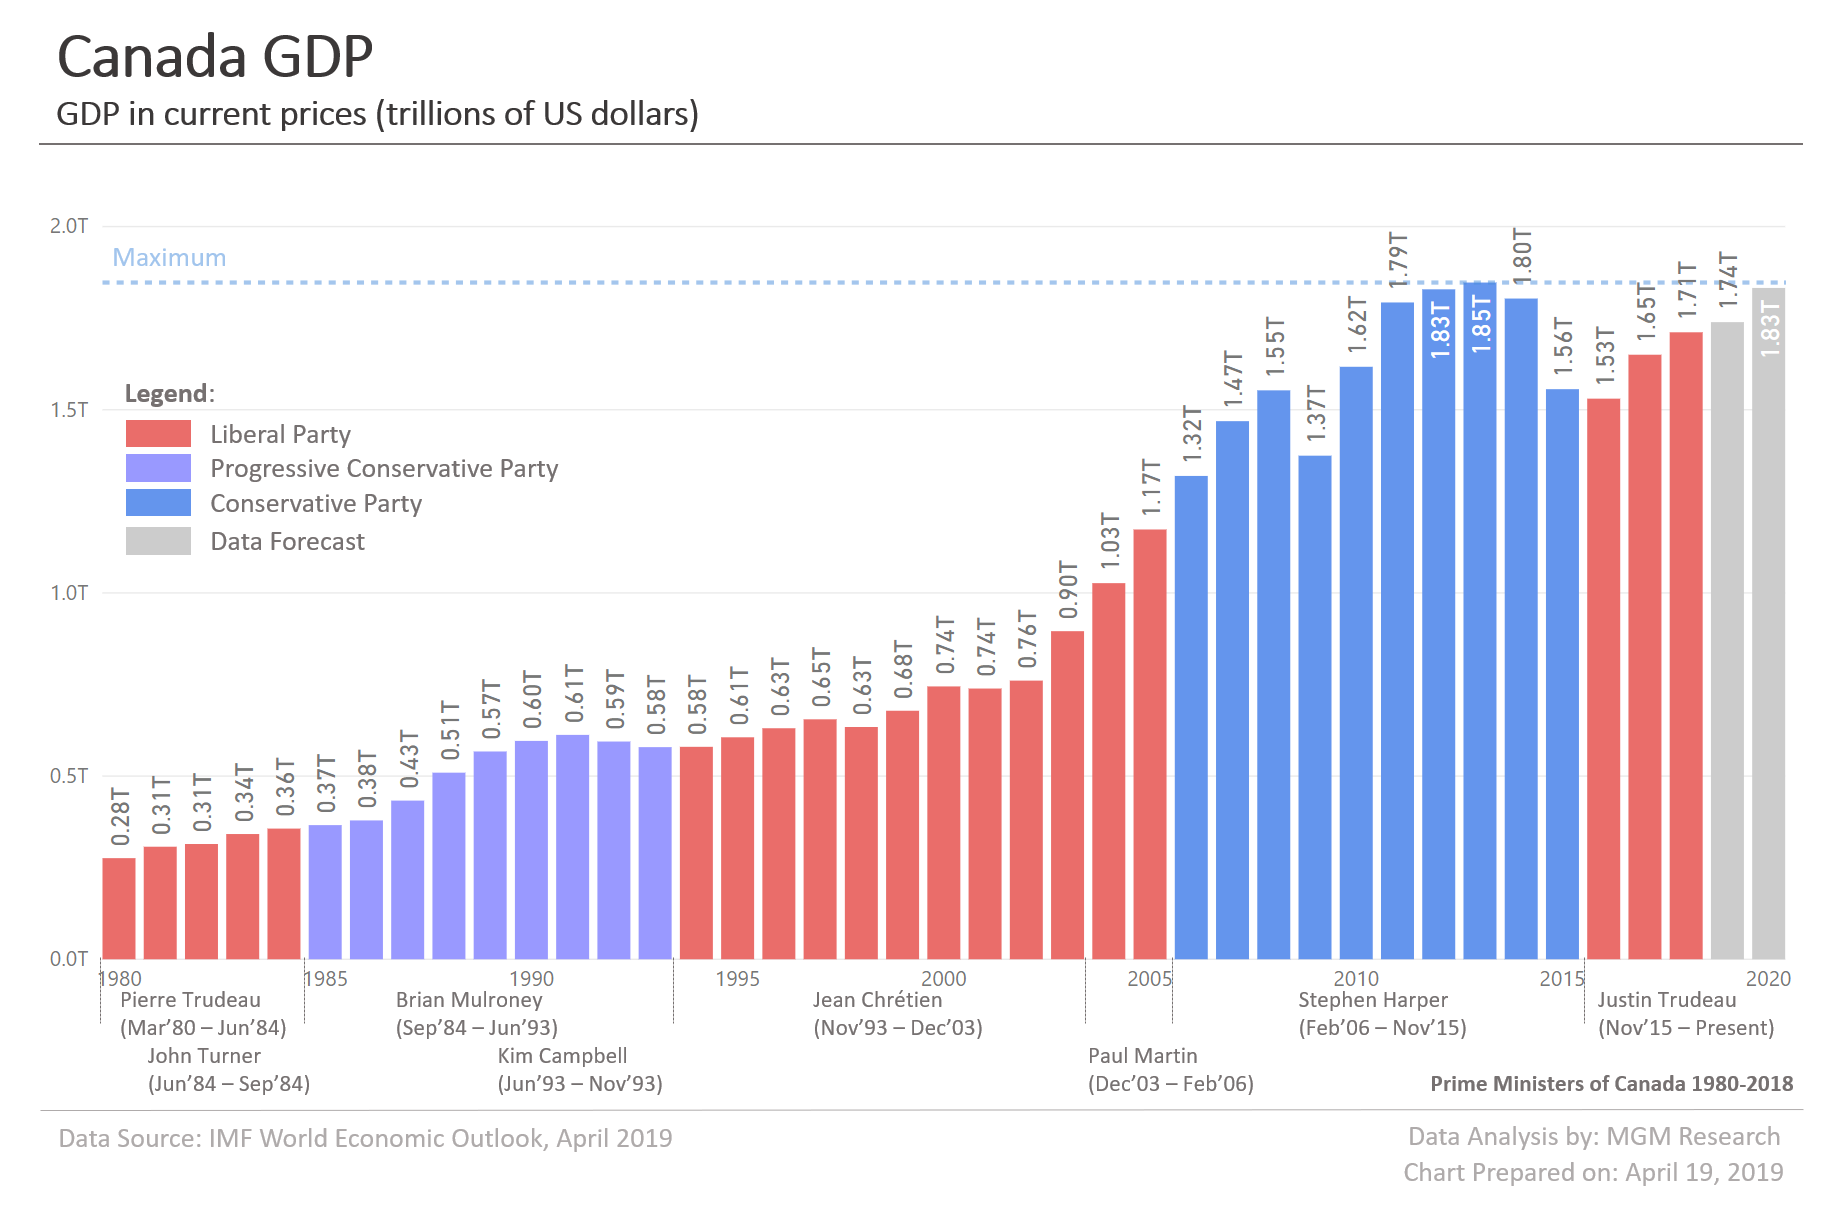
Canada GDP 1980-2020
Canada nominal GDP reached $1.71 trillion during 2018. IMF estimates Canada GDP to reach $1.74 trillion during 2019 and $1.83 trillion during 2020. The chart below provides Canada GDP data from 1980 to 2020.
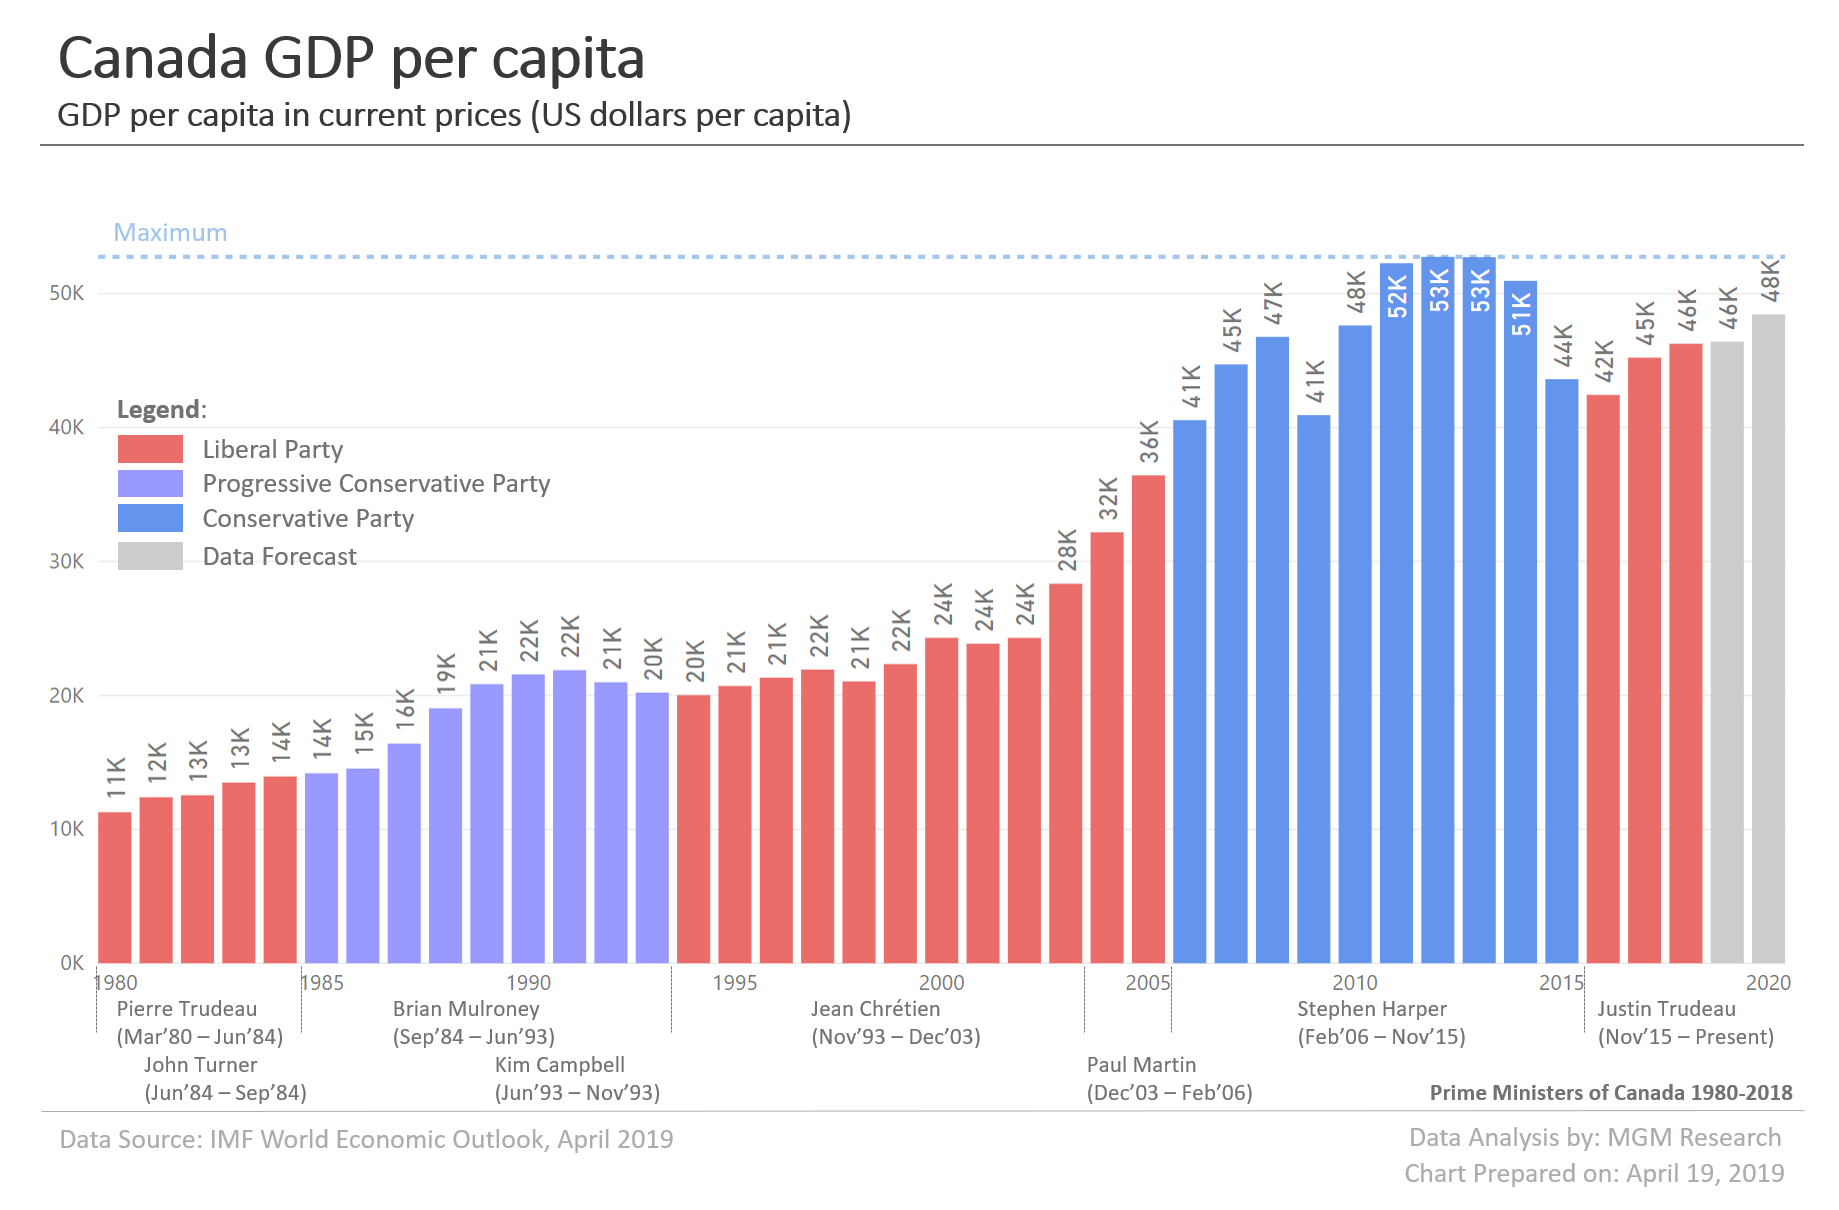
Canada GDP Per Capita 1980-2020
During 2018, Canada GDP per capita was $46,261. IMF estimates Canada GDP per capita to be $46,419 during 2019 and $48,451 during 2020. The chart below provides Canada GDP per capita data from 1980 to 2020.
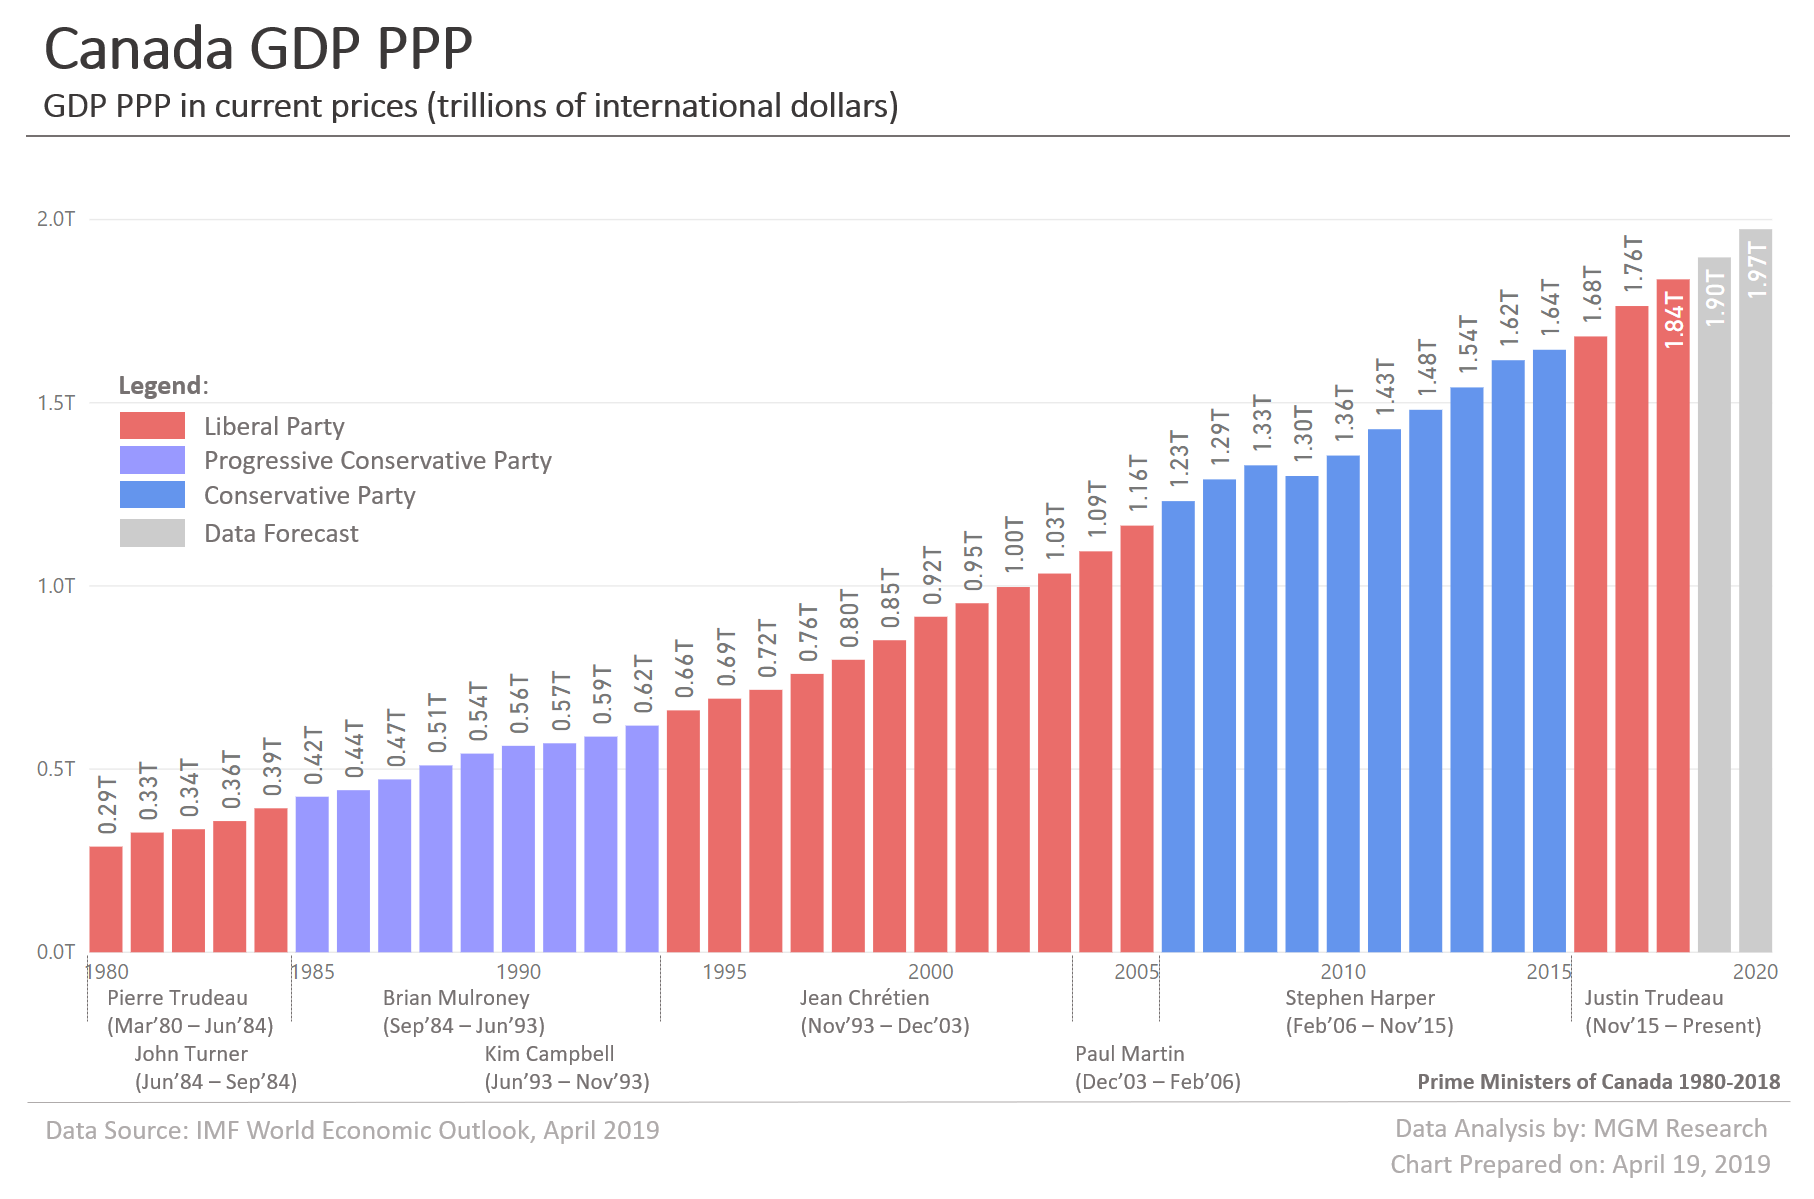
Canada GDP PPP 1980-2020
Canada GDP on a purchasing power parity basis (GDP PPP) reached $1.84 trillion during 2018. IMF estimates Canada GDP PPP to reach $1.90 trillion during 2019 and $1.97 trillion during 2020. The chart below provides Canada GDP PPP data from 1980 to 2020.
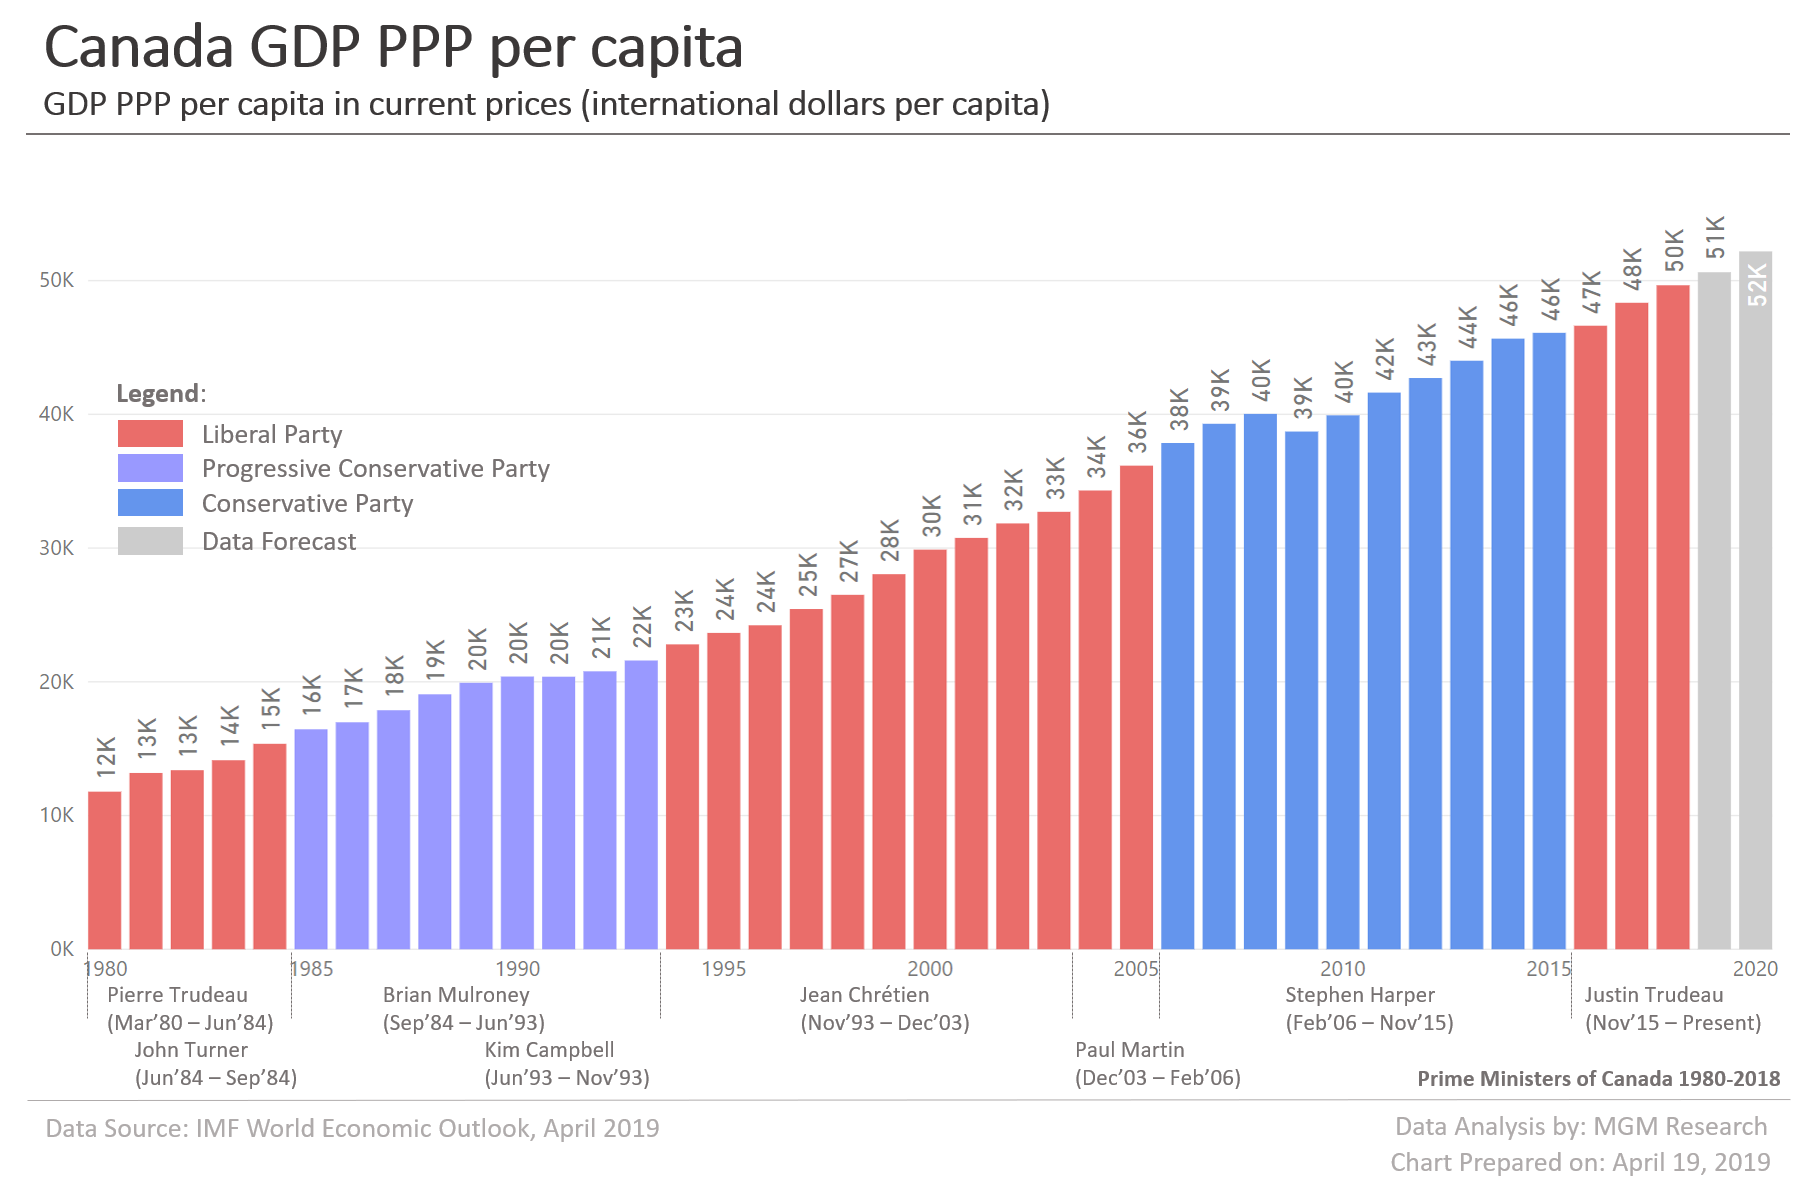
Canada GDP PPP per capita 1980-2020
During 2018, Canada GDP per capita on a purchasing power parity basis (GDP PPP per capita) was $49,651. IMF estimates Canada GDP PPP per capita to be $50,626 during 2019 and $52,185 during 2020. The chart below provides Canada GDP PPP per capita data from 1980 to 2020.
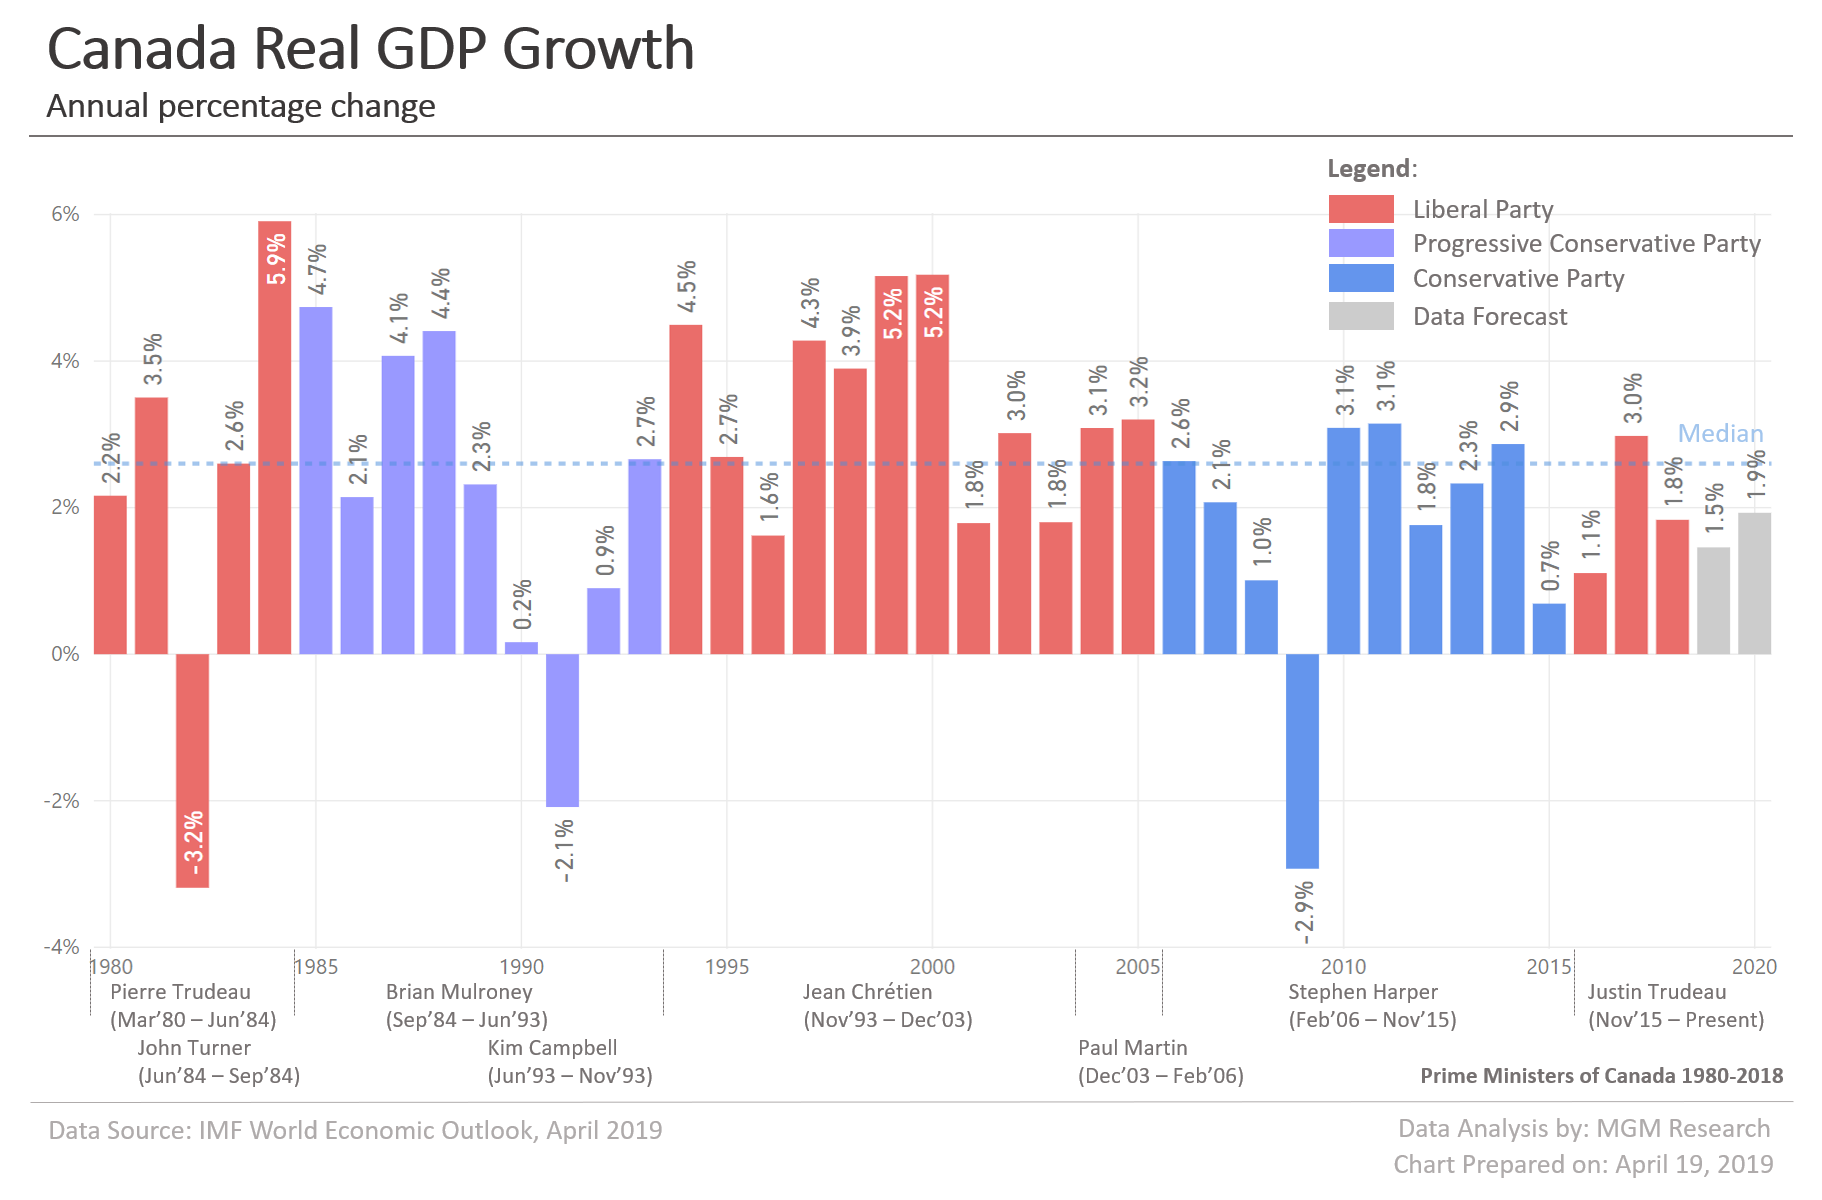
Canada Real GDP Growth 1980-2020
During 2018, Canada real GDP growth was 1.8%. IMF estimates Canada real GDP growth to be 1.5% during 2019 and 1.9% during 2020. The chart below provides Canada real GDP growth data from 1980 to 2020.
Canada GDP Data 1980-2020
The data table below provides the Canada GDP indicators related data from 1980 to 2020.
| Year | GDP ($bn) | GDP per capita ($) | GDP PPP ($bn) | GDP PPP per capita ($) | Real GDP Growth |
|---|---|---|---|---|---|
| 2020 | 1,832 | 48,451 | 1,974 | 52,185 | 1.9% |
| 2019 | 1,739 | 46,419 | 1,897 | 50,626 | 1.5% |
| 2018 | 1,711 | 46,261 | 1,837 | 49,651 | 1.8% |
| 2017 | 1,650 | 45,224 | 1,764 | 48,342 | 3.0% |
| 2016 | 1,530 | 42,447 | 1,681 | 46,627 | 1.1% |
| 2015 | 1,556 | 43,616 | 1,645 | 46,096 | 0.7% |
| 2014 | 1,804 | 50,958 | 1,616 | 45,661 | 2.9% |
| 2013 | 1,847 | 52,726 | 1,542 | 44,009 | 2.3% |
| 2012 | 1,829 | 52,753 | 1,481 | 42,716 | 1.8% |
| 2011 | 1,793 | 52,272 | 1,428 | 41,626 | 3.1% |
| 2010 | 1,617 | 47,625 | 1,356 | 39,926 | 3.1% |
| 2009 | 1,375 | 40,935 | 1,300 | 38,714 | -2.9% |
| 2008 | 1,553 | 46,776 | 1,329 | 40,035 | 1.0% |
| 2007 | 1,469 | 44,715 | 1,291 | 39,294 | 2.1% |
| 2006 | 1,319 | 40,557 | 1,231 | 37,857 | 2.6% |
| 2005 | 1,173 | 36,428 | 1,165 | 36,164 | 3.2% |
| 2004 | 1,027 | 32,183 | 1,094 | 34,305 | 3.1% |
| 2003 | 896 | 28,338 | 1,034 | 32,711 | 1.8% |
| 2002 | 761 | 24,295 | 997 | 31,843 | 3.0% |
| 2001 | 739 | 23,861 | 953 | 30,761 | 1.8% |
| 2000 | 745 | 24,301 | 916 | 29,884 | 5.2% |
| 1999 | 678 | 22,340 | 852 | 28,048 | 5.2% |
| 1998 | 634 | 21,047 | 798 | 26,504 | 3.9% |
| 1997 | 655 | 21,929 | 760 | 25,442 | 4.3% |
| 1996 | 631 | 21,326 | 716 | 24,226 | 1.6% |
| 1995 | 606 | 20,706 | 692 | 23,657 | 2.7% |
| 1994 | 580 | 20,025 | 660 | 22,800 | 4.5% |
| 1993 | 579 | 20,210 | 619 | 21,593 | 2.7% |
| 1992 | 594 | 20,984 | 589 | 20,784 | 0.9% |
| 1991 | 613 | 21,885 | 570 | 20,382 | -2.1% |
| 1990 | 596 | 21,572 | 564 | 20,394 | 0.2% |
| 1989 | 567 | 20,842 | 542 | 19,927 | 2.3% |
| 1988 | 509 | 19,041 | 510 | 19,066 | 4.4% |
| 1987 | 433 | 16,408 | 472 | 17,874 | 4.1% |
| 1986 | 379 | 14,539 | 442 | 16,973 | 2.1% |
| 1985 | 366 | 14,186 | 425 | 16,449 | 4.7% |
| 1984 | 357 | 13,947 | 393 | 15,364 | 5.9% |
| 1983 | 342 | 13,493 | 358 | 14,135 | 2.6% |
| 1982 | 315 | 12,544 | 336 | 13,391 | -3.2% |
| 1981 | 307 | 12,397 | 327 | 13,184 | 3.5% |
| 1980 | 276 | 11,280 | 288 | 11,786 | 2.2% |
Notes
Data Source: International Monetary Fund (IMF) World Economic Outlook (WEO) database, April 2019 edition.