In this article, we will share 11 charts comparing Singapore and Malaysia on the following indicators related to Gross Domestic Product (GDP): Nominal GDP, Nominal GDP per capita, GDP on a Purchasing Power Parity (PPP) basis, GDP PPP per capita, Real GDP Growth. We will use the publicly available data from International Monetary Fund (IMF).
Singapore vs Malaysia - GDP Comparison 1980-2023
During 1980, Singapore GDP was $12 billion and Malaysia GDP was $26 billion. Their GDP have been growing at a similar pace over the last four decades. In 2018, IMF estimates Singapore GDP to be $347 billion and Malaysia GDP to be the same. By 2023, IMF forecasts Singapore GDP to reach $435 billion and Malaysia GDP to reach $498 billion. The following chart compares the GDP of Singapore and Malaysia from 1980 to 2023.
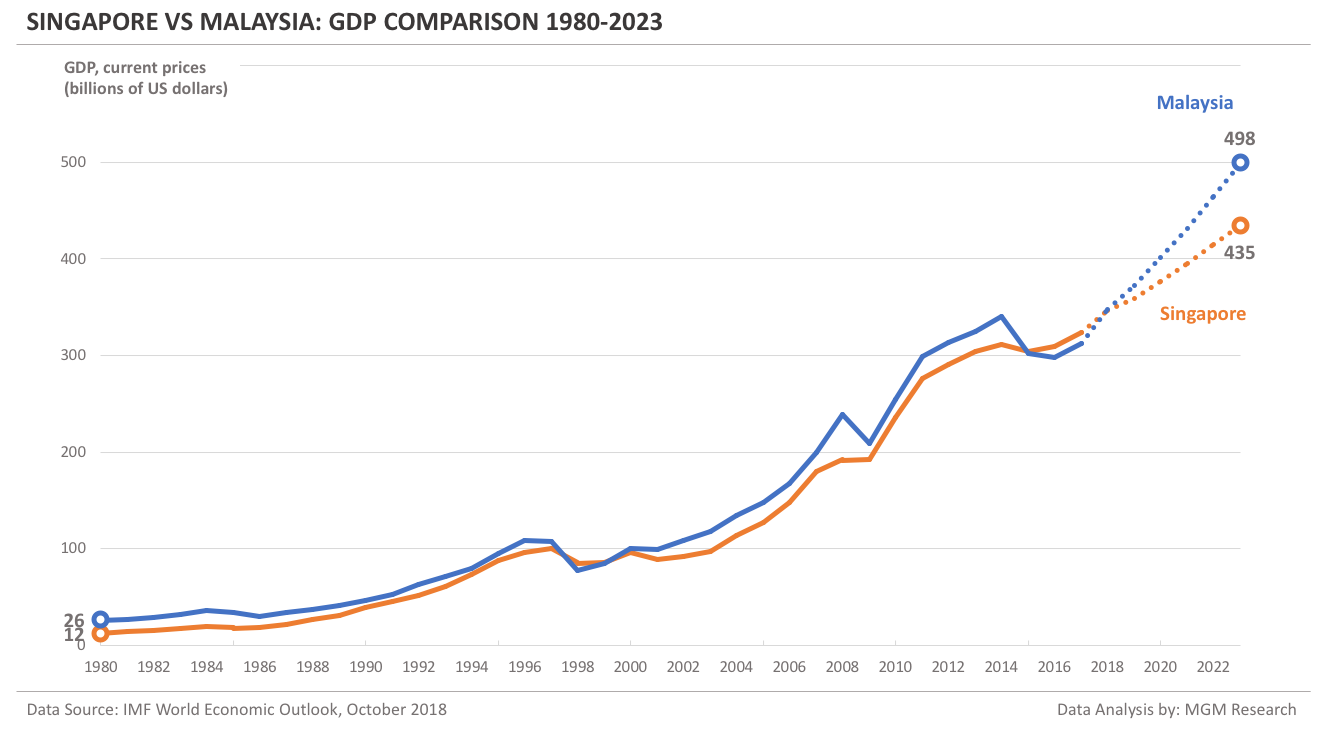
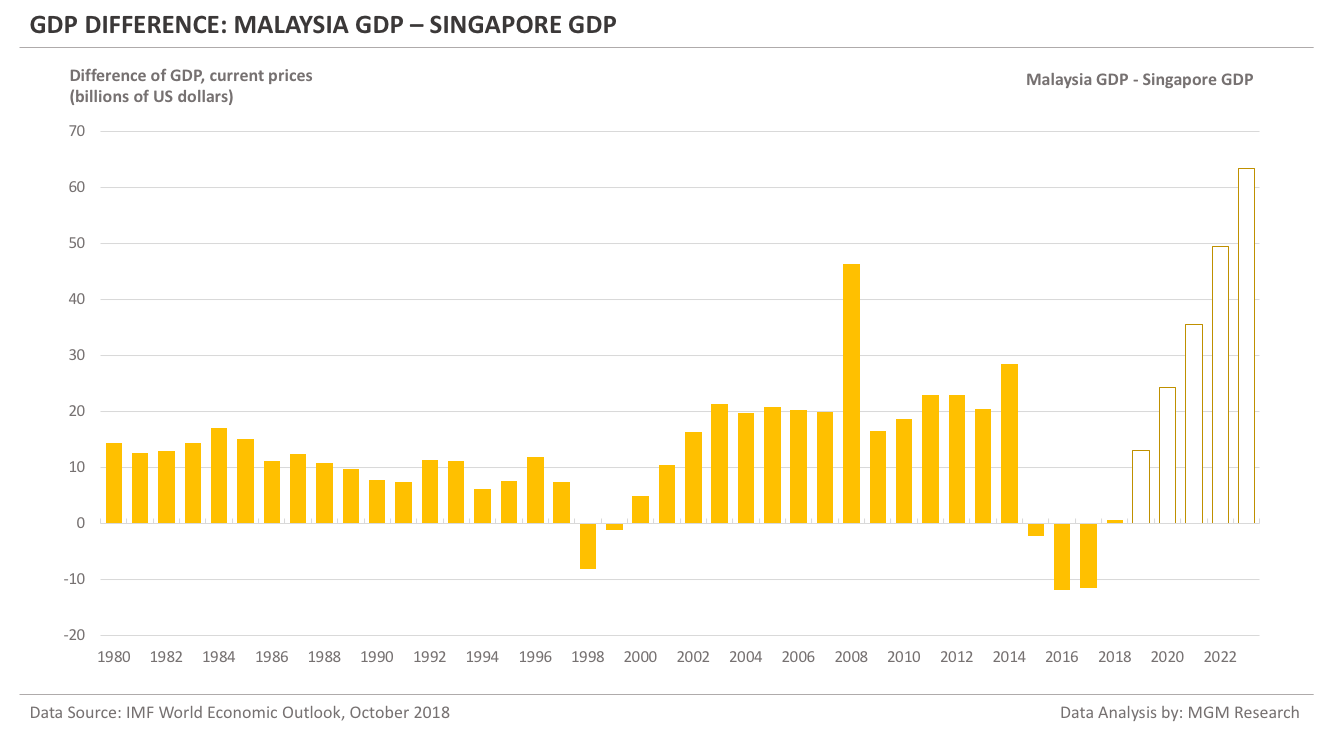
Singapore was ahead of Malaysia in GDP for only five times since 1980.
The following charts shows the difference between the GDP of Singapore and Malaysia from 1980 to 2023.
Singapore vs Malaysia - GDP comparison 2004 - 2023
Now, we will look at the Singapore and Malaysia GDP for the 20-year period from 2004 to 2023. We will see who has done better over the last 10 years, since the global recession in 2008. We will also look at the IMF forecast for Singapore and Malaysia from 2019 to 2023.
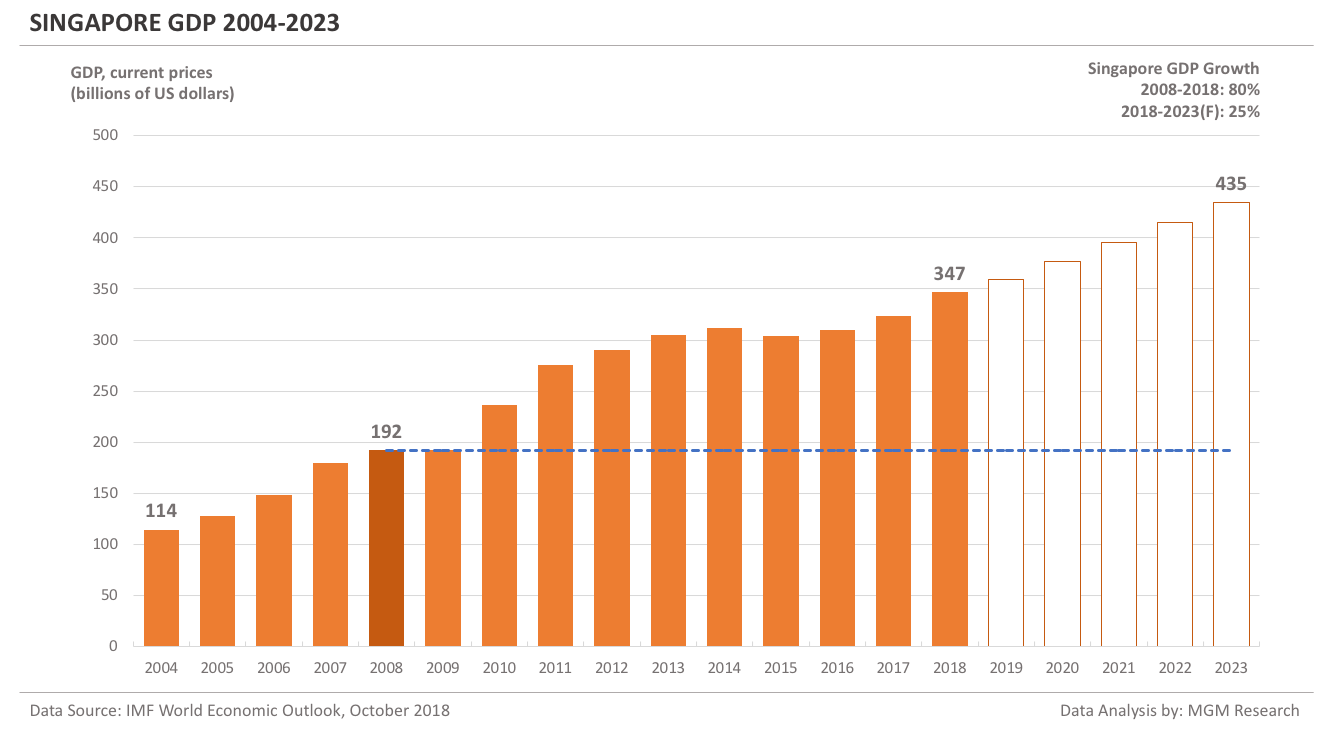
Singapore GDP in 2008 was $192 billion. IMF estimates Singapore GDP to reach $347 billion in 2018. In 10 years, from 2008 to 2018, Singapore GDP increased by 80%.
IMF forecasts Singapore GDP to reach $435 billion in 2023. So, in 5 years, from 2018 to 2023, IMF forecasts Singapore GDP to increase by 25%.
The following chart shows the GDP of Singapore from 2004 to 2023.
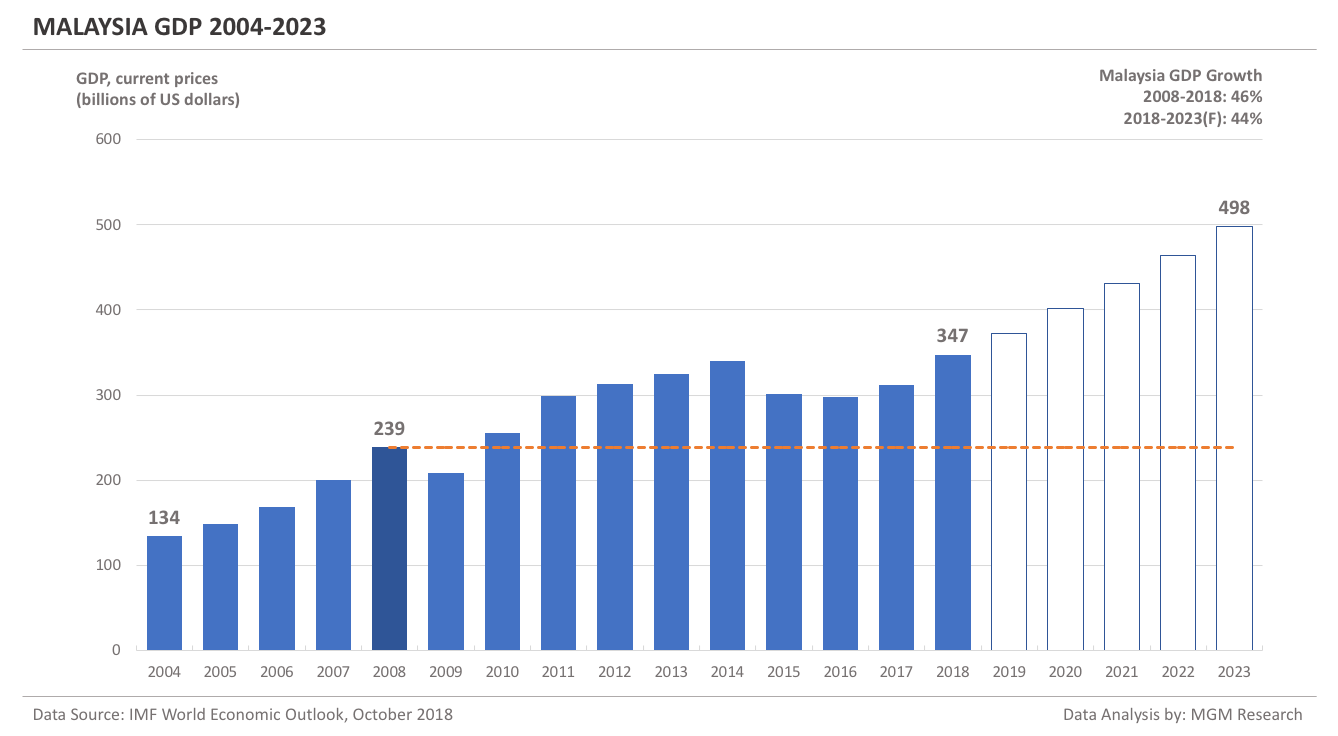
Malaysia GDP in 2008 was $239 billion. IMF estimates Malaysia GDP to reach $347 billion in 2018. In 10 years, from 2008 to 2018, Malaysia GDP increased by 46%.
IMF forecasts Malaysia GDP to reach $498 billion in 2023. So, in 5 years, from 2018 to 2023, IMF forecasts Malaysia GDP to increase by 44%.
Malaysia GDP was higher than Singapore GDP in 2008. But, in 2018, they are at a similar level. So, Singapore GDP has grown faster than Malaysia from 2008 to 2018. However, IMF forecasts Malaysia GDP to grow faster than Singapore over the next five years, from 2018 to 2023.
The following chart shows the GDP of Malaysia from 2004 to 2023.
Singapore vs Malaysia - Total Population Comparison 1980-2023
Before comparing GDP per capita, we will compare the population of Singapore and Malaysia.
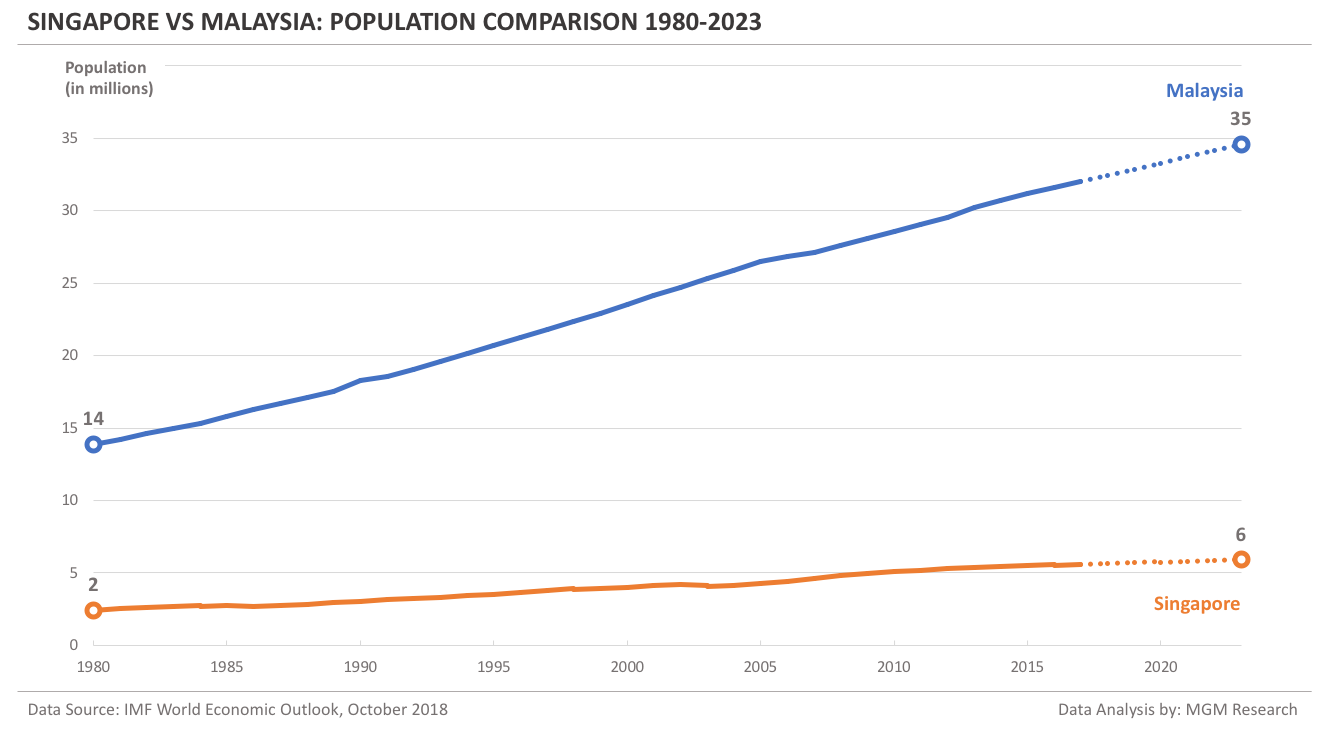
During 1980, Singapore population was 2.4 million and Malaysia population was 13.9 million. By the year 2000, Singapore population increased to 4 million and Malaysia population increased to 23.5 million.
In 2018, IMF estimates Singapore population to be 5.7 million and Malaysia population to be 32.4 million. By 2023, IMF forecasts Singapore population to reach 5.9 million and Malaysia population to reach 34.6 million.
Malaysia population is nearly six-times more than the Singapore population.
The following chart compares the population of Singapore and Malaysia from 1980 to 2023.
Singapore vs Malaysia - GDP per capita Comparison 1980-2023
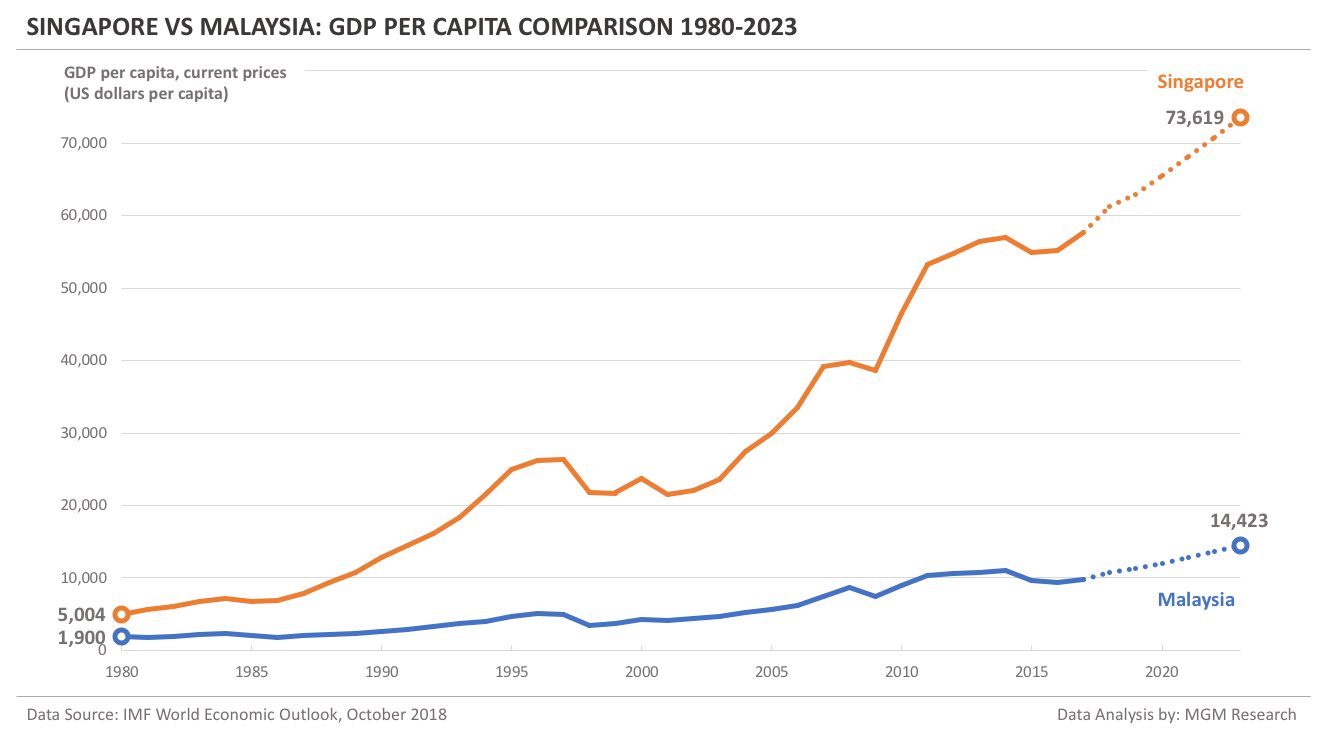
During 1980, Singapore GDP per capita was $5,004 and Malaysia GDP per capita was $1,900. By the year 2000, Singapore GDP per capita increased to $23,793 and Malaysia GDP per capita increased to $4,287.
In 2018, IMF estimates Singapore GDP per capita to be $61,230 and Malaysia GDP per capita to be $10,704. By 2023, IMF forecasts Singapore GDP per capita to reach $73,619 and Malaysia GDP per capita to reach $14,423.
Singapore GDP per capita is over five-times more than the Malaysia GDP per capita.
The following chart compares the GDP per capita of Singapore and Malaysia from 1980 to 2023.
Singapore vs Malaysia - GDP PPP Comparison 1980-2023
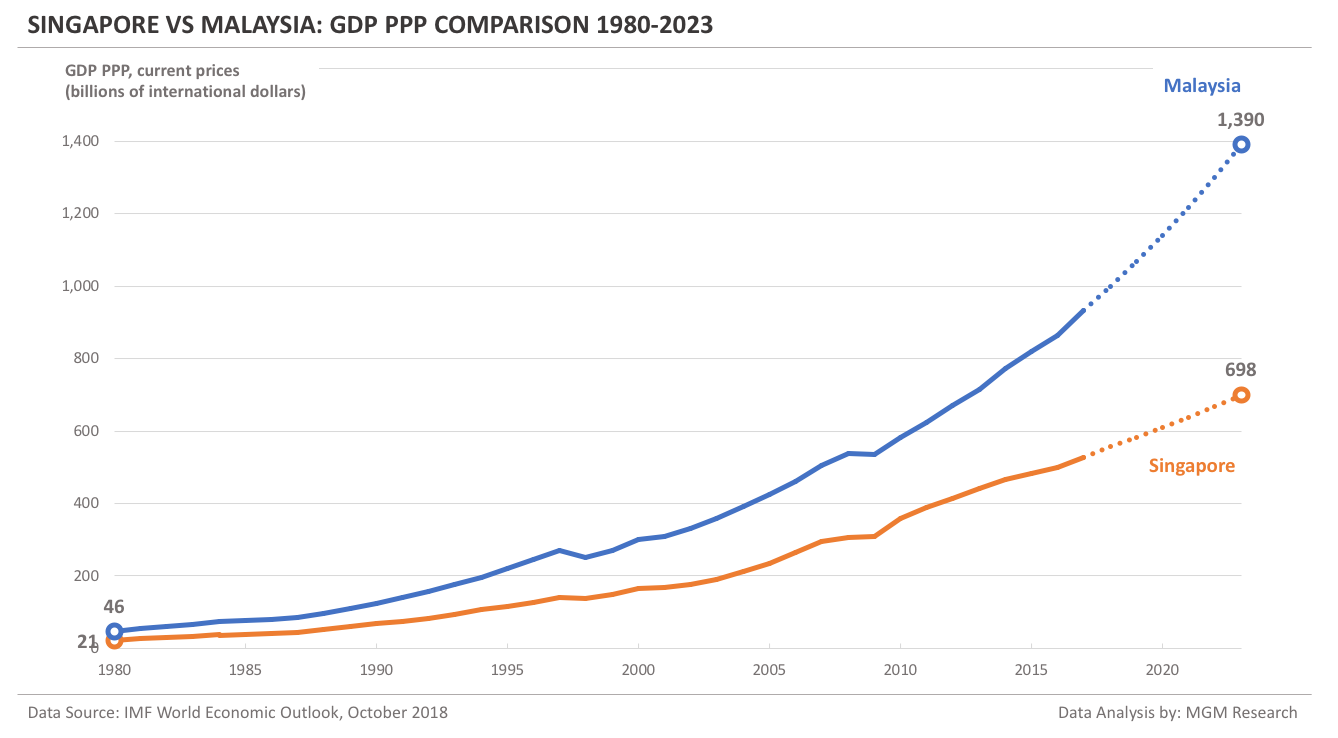
During 1980, Singapore GDP PPP was $21 billion and Malaysia GDP PPP was $46 billion. By the year 2000, Singapore GDP PPP increased to $166 billion and Malaysia GDP PPP increased to $302 billion.
In 2018, IMF estimates Singapore GDP PPP to be $556 billion and Malaysia GDP PPP to be $1,000 billion. By 2023, IMF forecasts Singapore GDP PPP to reach $698 billion and Malaysia GDP PPP to reach $1,390 billion.
Malaysia GDP on a Purchasing Power Parity (PPP) basis is nearly twice the Singapore GDP PPP.
The following chart compares the GDP PPP of Singapore and Malaysia from 1980 to 2023.
Singapore vs Malaysia - GDP PPP per capita Comparison 1980-2023
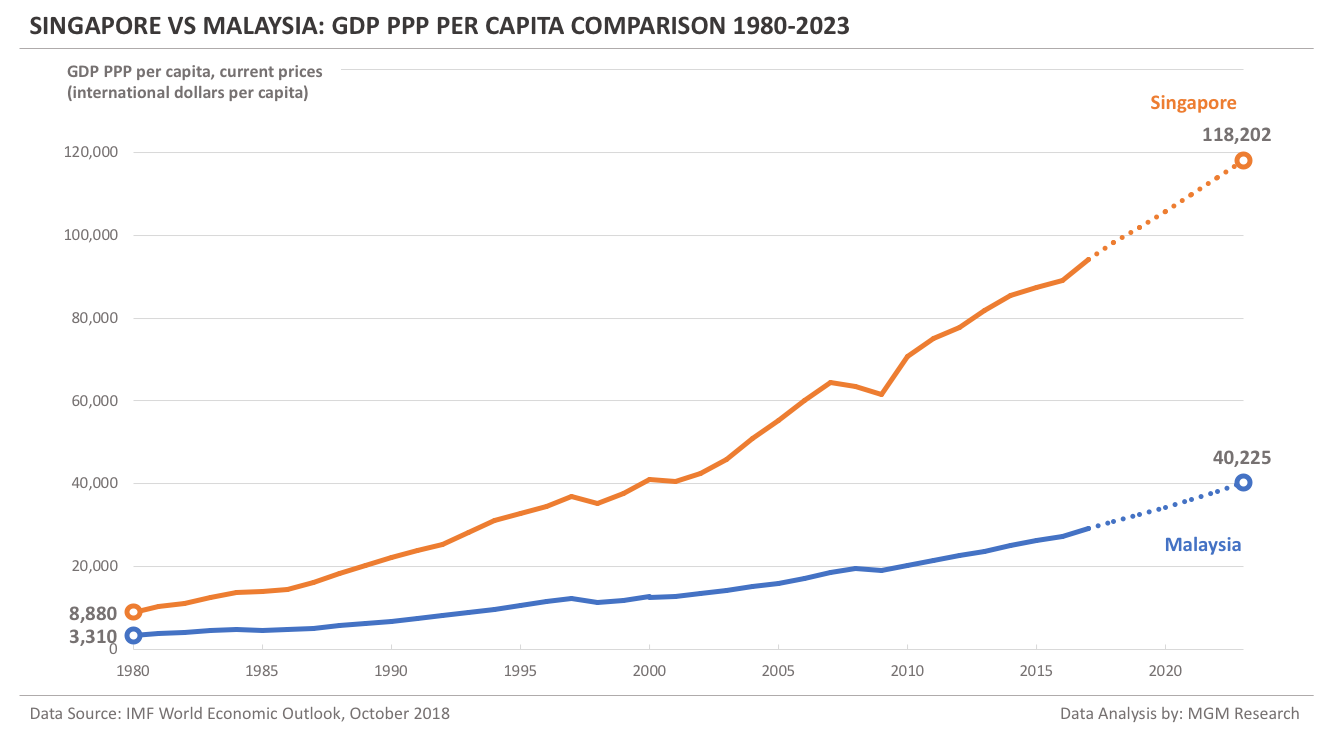
During 1980, Singapore GDP PPP per capita was $8,880 and Malaysia GDP PPP per capita was $3,310. By the year 2000, Singapore GDP PPP per capita increased to $41,145 and Malaysia GDP PPP per capita increased to $12,839.
In 2018, IMF estimates Singapore GDP PPP per capita to be $98,255 and Malaysia GDP PPP per capita to be $30,815. By 2023, IMF forecasts Singapore GDP PPP per capita to reach $118,202 and Malaysia GDP PPP per capita to reach $40,225.
Singapore GDP PPP per capita is nearly three times the Malaysia GDP PPP per capita.
The following chart compares the GDP PPP per capita of Singapore and Malaysia from 1980 to 2023.
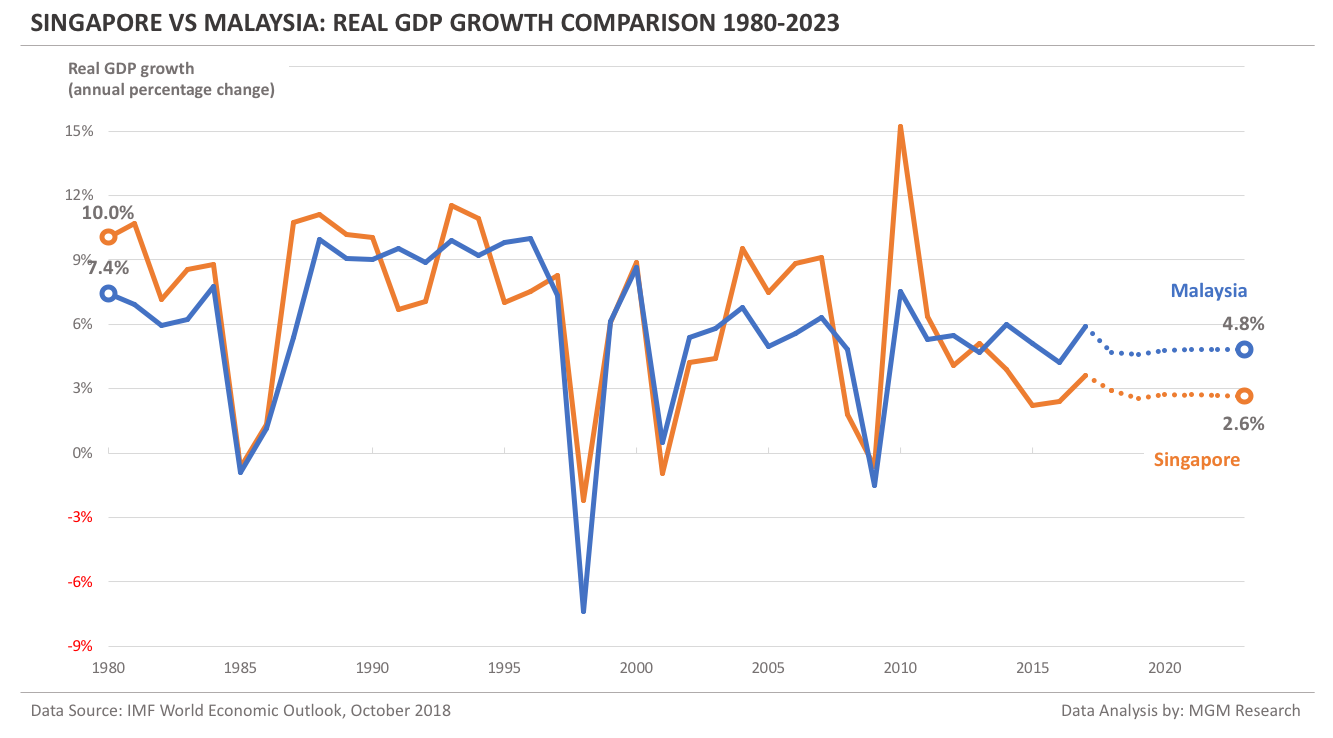
Singapore vs Malaysia - Real GDP Growth Comparison 1980-2023
Singapore and Malaysia had a similar real GDP growth (the one computed from the GDP reported in national currencies) curve from 1980 to 2018. In 2018, IMF estimates Malaysia real GDP growth to be 4.7%. This is ahead of the Singapore real GDP growth of 2.9%. IMF forecasts that Malaysia real GDP growth would be more than Singapore over the next five years. The following chart shows the real GDP growth of Singapore and Malaysia from 1980 to 2023.
Singapore vs Malaysia - GDP Indicators Summary 2019
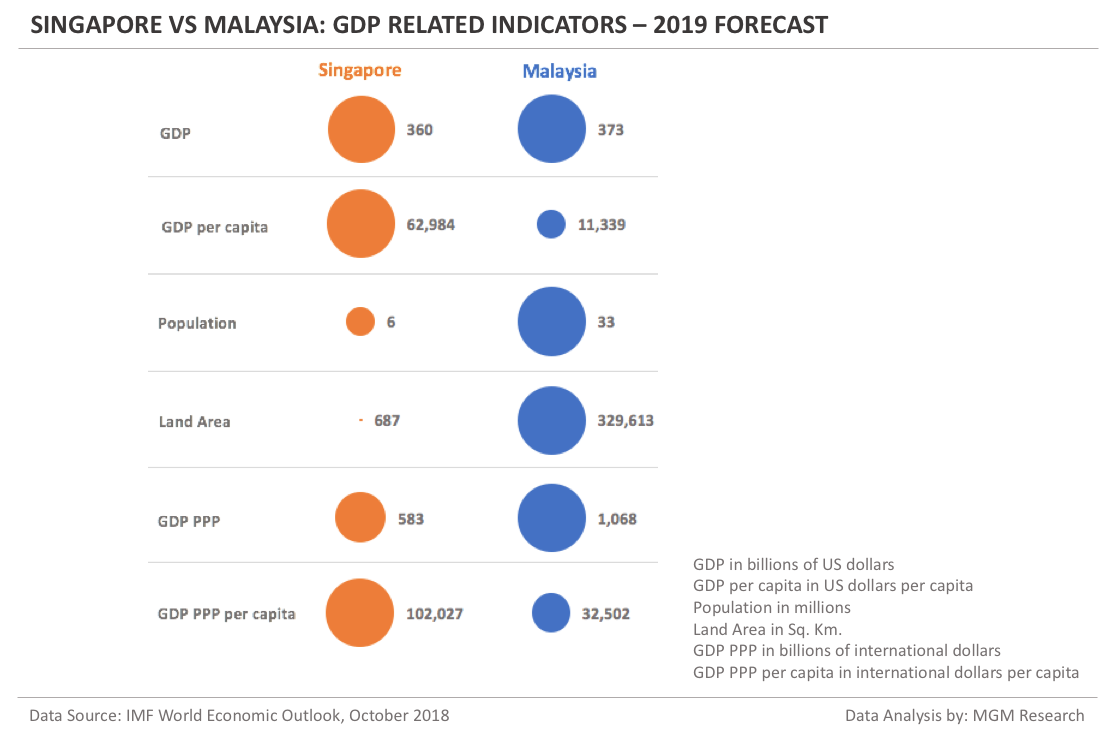
Before comparing IMF 2019 GDP forecasts for Singapore and Malaysia, lets us look at their land area. Singapore land area is 687 sq km and Malaysia land area is 329,613 sq km. So, Malaysia land area is 480-times Singapore land area.
In 2019, IMF forecasts:
- Singapore GDP to be $360 billion and Malaysia GDP to be $373 billion. So, Malaysia GDP would be little ahead of Singapore GDP.
- Singapore GDP per capita to be $62,984 and Malaysia GDP per capita to be $11,339. So, Singapore GDP per capita would be 5.6-times Malaysia GDP per capita.
- Singapore population to be 5.7 million and Malaysia population to be 32.9 million. So, Malaysia population would be nearly six times Singapore population.
- Singapore GDP PPP to be $583 billion and Malaysia GDP PPP to be $1,068 billion. So, Malaysia GDP PPP would be nearly twice Singapore GDP PPP.
- Singapore GDP PPP per capita to be $102,027 and Malaysia GDP PPP per capita to be $32,502. So, Singapore GDP PPP per capita would be over three times Malaysia GDP PPP per capita.
- Singapore real GDP growth to be 2.5% and Malaysia real GDP growth to be 4.6%.
The following chart shows a summary of the GDP related indicators of Singapore and Malaysia during 2019.
Singapore vs Malaysia - GDP and GDP per capita growth summary
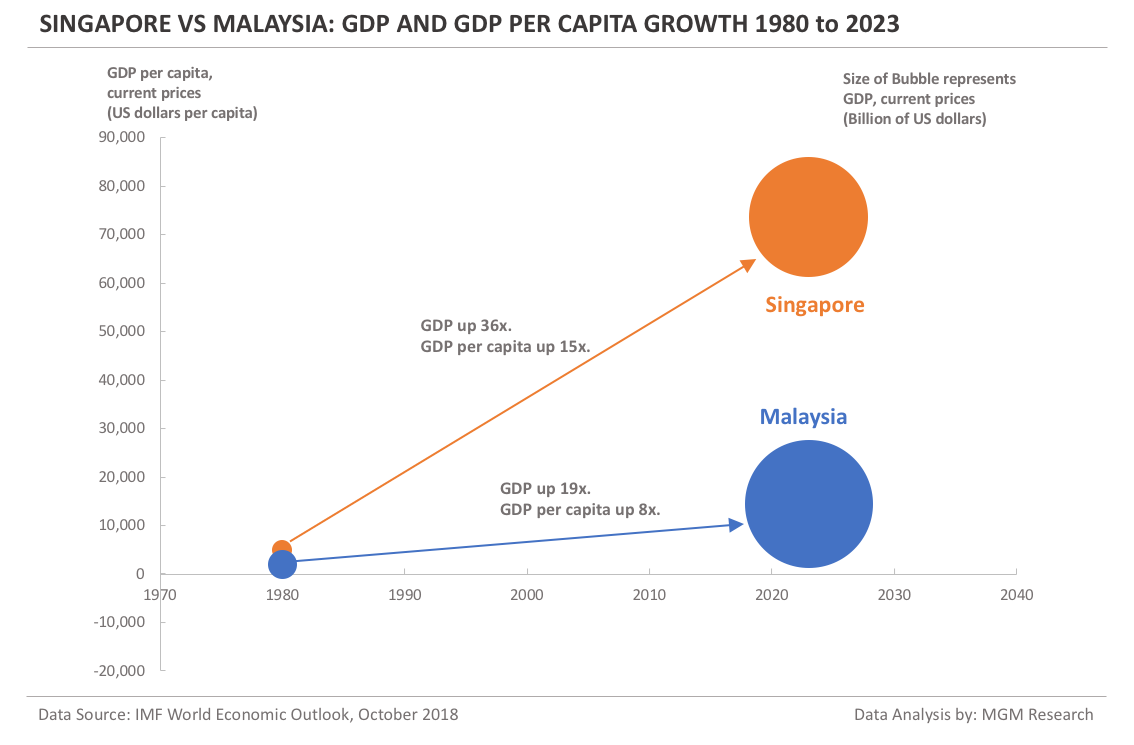
Singapore GDP during 1980 was $12 billion and GDP per capita was $5,004. IMF forecasts Singapore GDP to reach $435 billion and GDP per capita to reach $73,619 by 2023, implying an increase of 36-times and 15-times respectively during the 43-year period.
Malaysia GDP during 1980 was $26 billion and GDP per capita was $1,900. IMF forecasts Malaysia GDP to reach $498 billion and GDP per capita to reach $14,423 by 2023, implying an increase of 19-times and 8-times respectively during the 43-year period.
The following chart shows the increase in GDP and GDP per capita of Singapore and Malaysia from 1980 to 2023.
Notes
1. Data Source: International Monetary Fund (IMF) World Economic Outlook (WEO) database, October 2018 edition.
Related Pages