In this article, we will provide a comparison of Amazon and Walmart revenues and profits over the 20-year period from 1999 to 2018.
Amazon is a global technology leader in online retail and cloud computing. Amazon businesses encompass a large variety of product types, service offerings, and delivery channels. Amazon primary customer sets consist of consumers, sellers, developers, enterprises, and content creators. Amazon makes money primarily by selling consumer products and subscriptions through its North America and International websites. In addition, Amazon sells cloud services for on-demand delivery of IT resources and applications via Internet.
Walmart is engaged in the operation of retail, wholesale and other units, as well as eCommerce websites, located throughout the U.S., Africa, Argentina, Brazil, Canada, Central America, Chile, China, India, Japan, Mexico and the United Kingdom. Each week, the Company serves nearly 270 million customers who visit its more than 11,700 stores and numerous eCommerce websites under 65 banners in 28 countries.
Amazon vs Walmart - Revenues Comparison 1999-2018
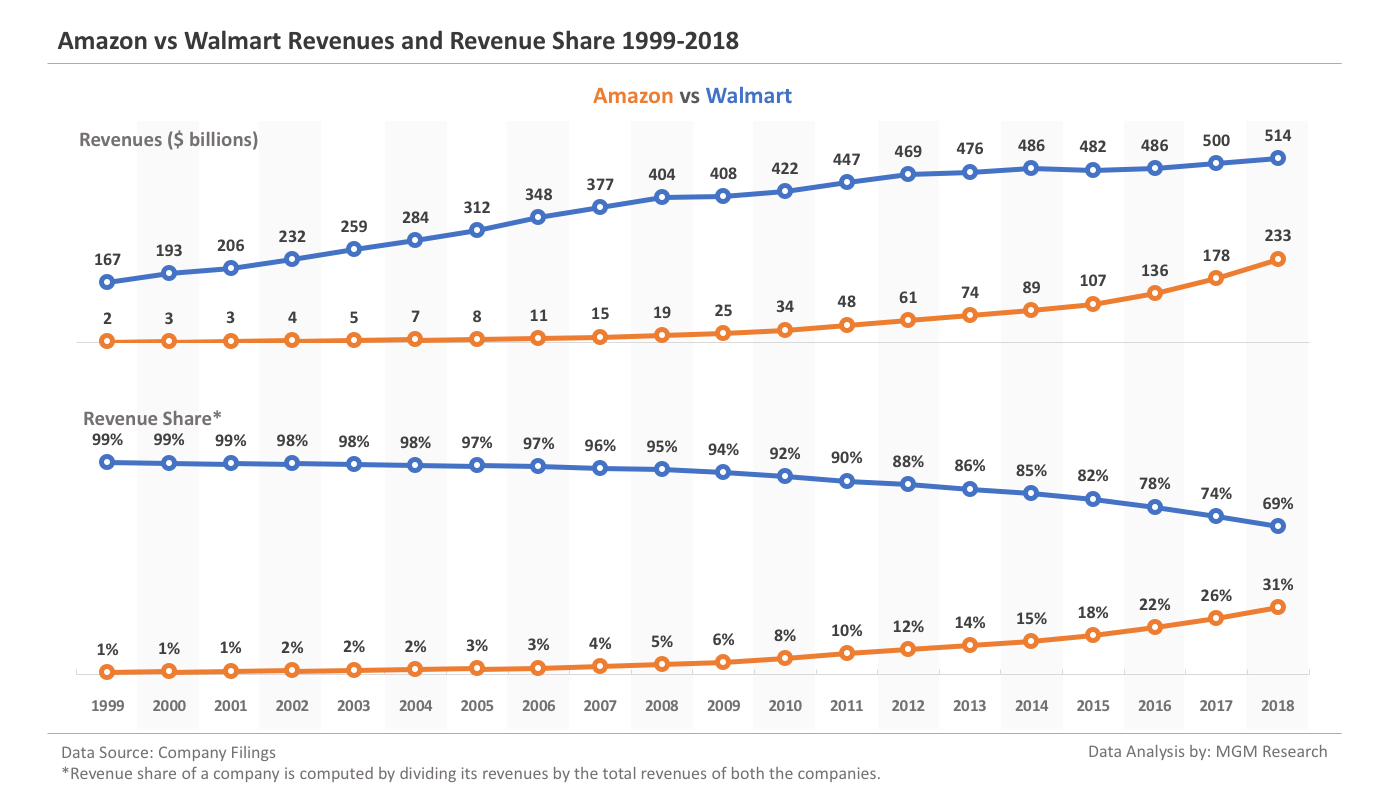
20 years ago, in 1999, Amazon revenues were $2 billion and Walmart revenues were $167 billion. Walmart revenue share (computed by dividing Walmart revenues with the combined revenues of Amazon and Walmart) was 99%. Because of a faster revenue growth than Walmart, Amazon revenue share has continue to increase.
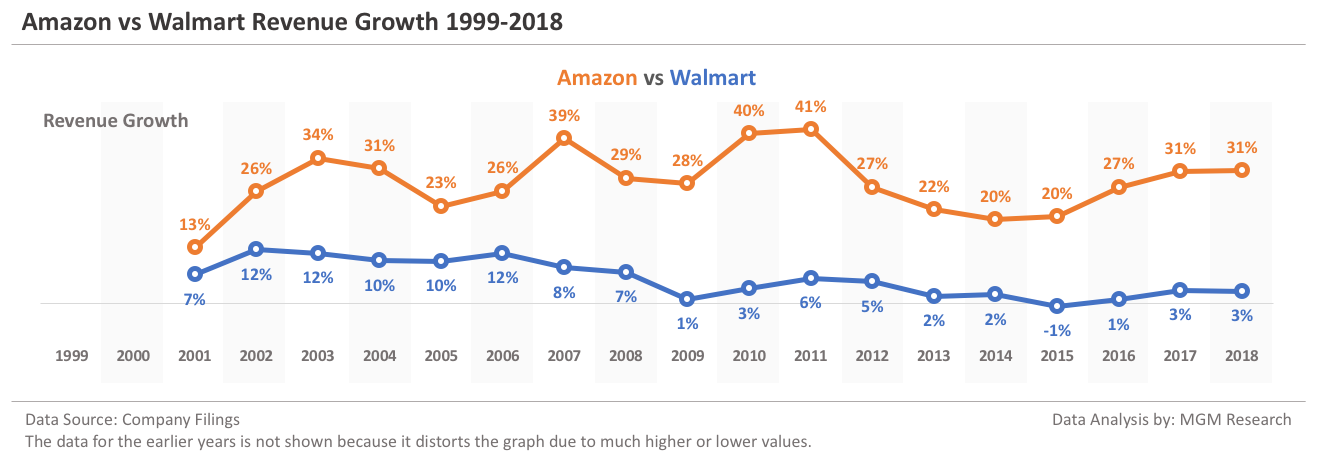
In 2014, Amazon revenue share reached 15%. While it took Amazon 15 years to increase its revenue share from 1% to 15%, it increased its revenue share to 31% in just four years. In 2018, Amazon generated revenues of $233 billion, whereas Walmart reported total revenues of $514 billion. In 2018, Amazon revenue share was 31% and Walmart revenue share was 69%.
The charts below provide the data for Amazon and Walmart revenues, revenue share, and revenue growth for 20 years from 1999 to 2018.
Amazon vs Walmart - Net Income Comparison 1999-2018
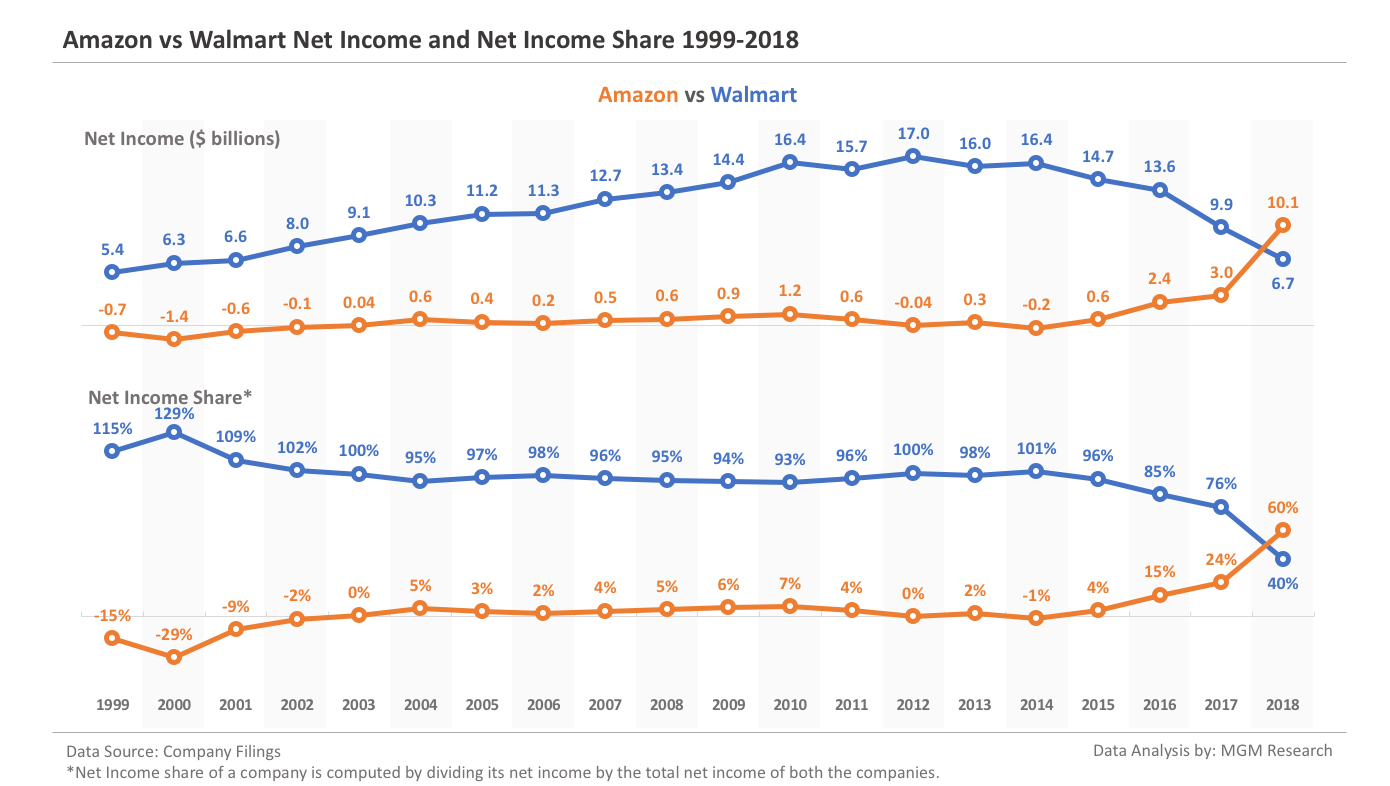
20 years ago, in 1999, Amazon reported a net income -$0.7 billion and Walmart net income $5.4 billion. Walmart net income share (computed by dividing Walmart net income with the combined net income of Amazon and Walmart) was 115%. Walmart net income share remained more than 90% from 1999 to 2015.
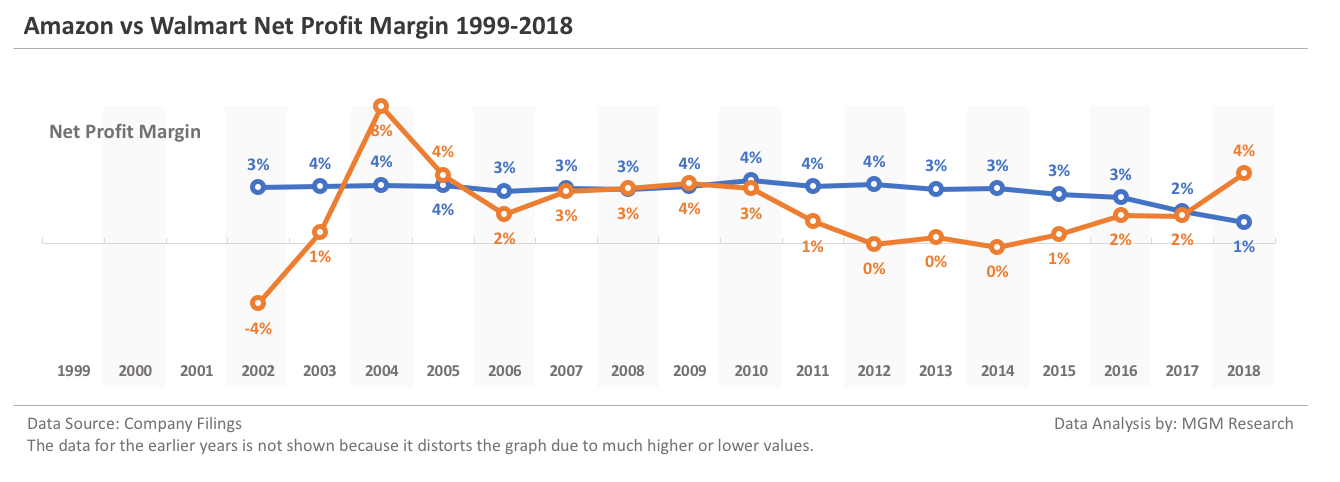
From 2015 to 2018, Amazon net income share has been on an increase. In 2018, Amazon reported a net income more than the Walmart. Amazon reported a net income of $10.1 billion, whereas Walmart net income was $6.7 billion. In 2018, Amazon net income share was 60%, whereas Walmart net income share was 40%.
The charts below provide the data for Amazon and Walmart net income, net income share, and net profit margin for 20 years from 1999 to 2018.
Amazon vs Walmart - Business Segments Revenues and Operating Income 2018
Amazon Business Segments Revenues and Operating Income 2018
Amazon reports its revenues for the following business segments: North America, International, and AWS. Here is a brief description of these business segments:
The North America segment consists primarily of amounts earned from retail sales of consumer products (including from sellers) and subscriptions through North America-focused websites such as http://www.amazon.com, http://www.amazon.ca, and http://www.amazon.com.mx. This segment includes export sales from these websites.
The International segment consists primarily of amounts earned from retail sales of consumer products (including from sellers) and subscriptions through internationally-focused websites such as http://www.amazon.com.au, http://www.amazon.com.br, http://www.amazon.cn, http://www.amazon.fr, http://www.amazon.de, http://www.amazon.in, http://www.amazon.it, http://www.amazon.co.jp, http://www.amazon.nl, http://www.amazon.es, and http://www.amazon.co.uk. This segment includes export sales from these internationally-focused websites (including export sales from these sites to customers in the U.S., Mexico, and Canada), but excludes export sales from North American websites.
The Amazon Web Services (AWS) segment consists of amounts earned from global sales of compute, storage, database, and other AWS service offerings for start-ups, enterprises, government agencies, and academic institutions.
Amazon Business Segments Revenues 2018
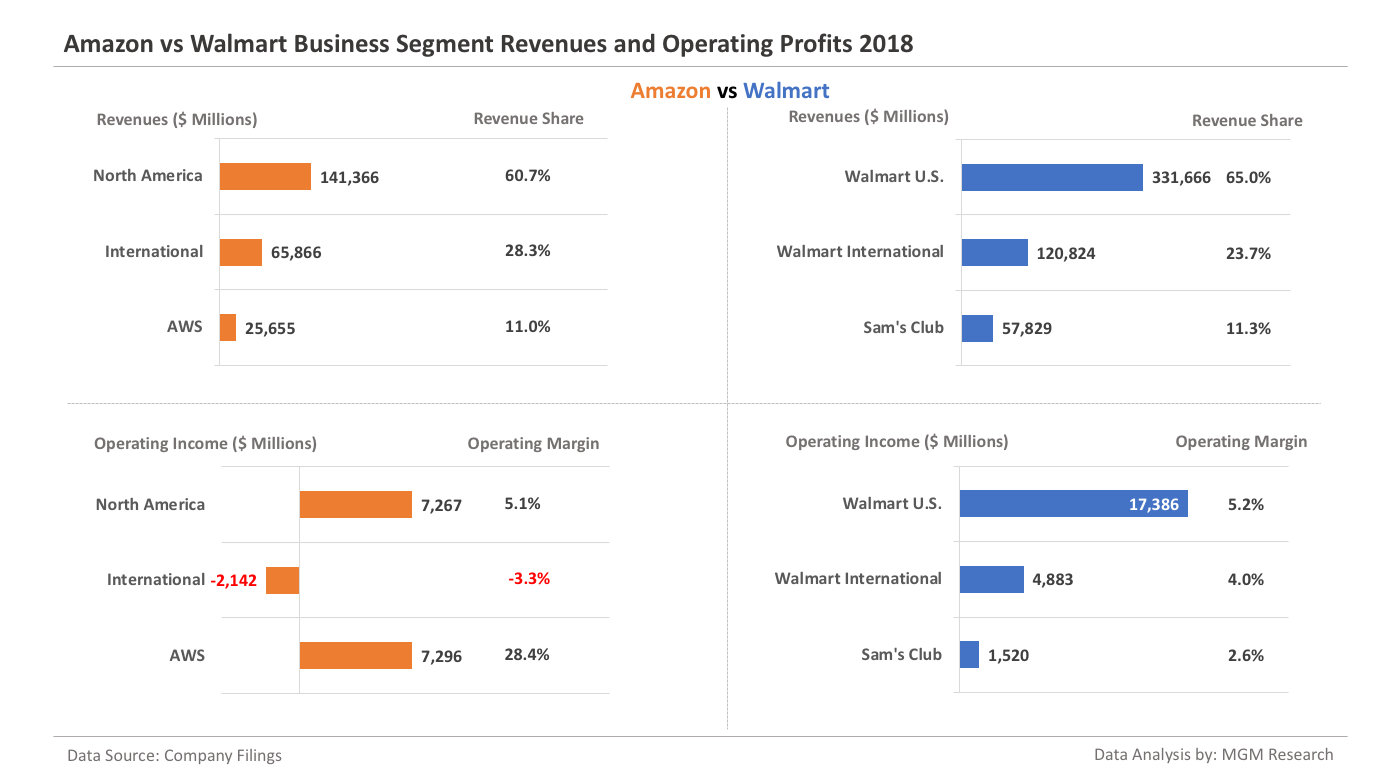
Of the $233 billion of total net sales in 2018, Amazon generated:
- $141 billion, 61% of the total, from the North America segment;
- $66 billion, 28% of the total, from the International segment; and
- $26 billion, 11% of the total, from the Amazon Web Services (AWS) segment.
Amazon Business Segments Operating Profits 2018
The operating income and operating margin of the Amazon business segments during 2018 is provided as follows:
- North America segment had a segment operating income of $7.3 billion and a segment operating margin of 5.1%;
- International segment had a segment operating income of -$2.2 billion and a segment operating margin of -3.3%; and
- AWS segment had a segment operating income of $7.3 billion and a segment operating margin of 28.4%.
Walmart Business Segments Revenues and Operating Income 2018
Walmart operations comprise three reportable segments: Walmart U.S., Walmart International and Sam’s Club. Here is a brief description of these business segments:
The Walmart U.S. segment is a mass merchandiser of consumer products, operating under the “Walmart,” “Wal-Mart” and “Walmart Neighborhood Market” brands, as well as walmart.com and other eCommerce brands. Walmart U.S. operates retail stores in the U.S., including in all 50 states, Washington D.C. and Puerto Rico, with supercenters in 49 states, Washington D.C. and Puerto Rico, discount stores in 41 states and Puerto Rico and Neighborhood Markets and other small store formats in 36 states, Washington D.C. and Puerto Rico.
Walmart International segment consists of operations in 27 countries outside of the U.S. and is divided into three major categories: retail, wholesale and other. These categories consist of many formats, including: supercenters, supermarkets, hypermarkets, warehouse clubs (including Sam’s Clubs) and cash & carry, as well as eCommerce.
The Sam’s Club segment includes the warehouse membership clubs in the U.S., as well as samsclub.com. Sam’s Club operates in 44 states in the U.S. and in Puerto Rico.
Walmart Business Segments Revenues 2018
Walmart generated a total of $514 billion revenues in 2018. Of those revenues, $510 billion were net sales and $4 billion came from membership and other income.
Of the $510 billion of total net sales in 2018, Walmart generated:
- $332 billion, 65% of the total, from the Walmart U.S. segment;
- $121 billion, 24% of the total, from the Walmart International segment; and
- $58 billion, 11% of the total, from the Sam’s Club segment.
Walmart Business Segments Operating Profits 2018
The operating income and operating margin of the Walmart business segments during 2018 is provided as follows:
- Walmart U.S. segment had a segment operating income of $17.4 billion and a segment operating margin of 5.2%;
- Walmart International segment had a segment operating income of $4.9 billion and a segment operating margin of 4.0%; and
- Sam’s Club segment had a segment operating income of $7.3 billion and a segment operating margin of 2.6%.
The diagram below provides the charts for Amazon and Walmart business segments revenues, revenue share, operating profit, and operating profit margins.
Notes
Amazon fiscal year ends in December and Walmart fiscal year ends in January. In this article, we have compared Amazon 2018 revenues (12-months ending December 2018) with Walmart revenues for the 12-month period ending in January 2019. We have referred to that period as 2018 only because it includes 11 months of 2018 revenues.
Related Articles
Amazon Revenues and Profits Analysis - 2019 Update
Amazon Profits Exceed Walmart For the First Time