In this article, we will share the ranking of 193 countries in the world based on their Gross Domestic Product (GDP) during 2018. We have used the publicly available data from International Monetary Fund (IMF) to rank the countries. We have also provided an analysis based on whether the countries are developed or developing. IMF classifies these countries as ‘advanced economies’ and ’emerging market and developing economies’ respectively (Please see the notes at the bottom). Of the 193 countries, 39 countries classified as advanced economies and the remaining are classified as emerging market and developing economies.
This article is part of a series of articles ranking the countries in the world based on their GDP related indicators. In our other articles, we have provided world GDP per capita rankings , world GDP PPP (purchasing power parity) rankings , world GDP PPP per capita rankings , and world real GDP growth rankings.
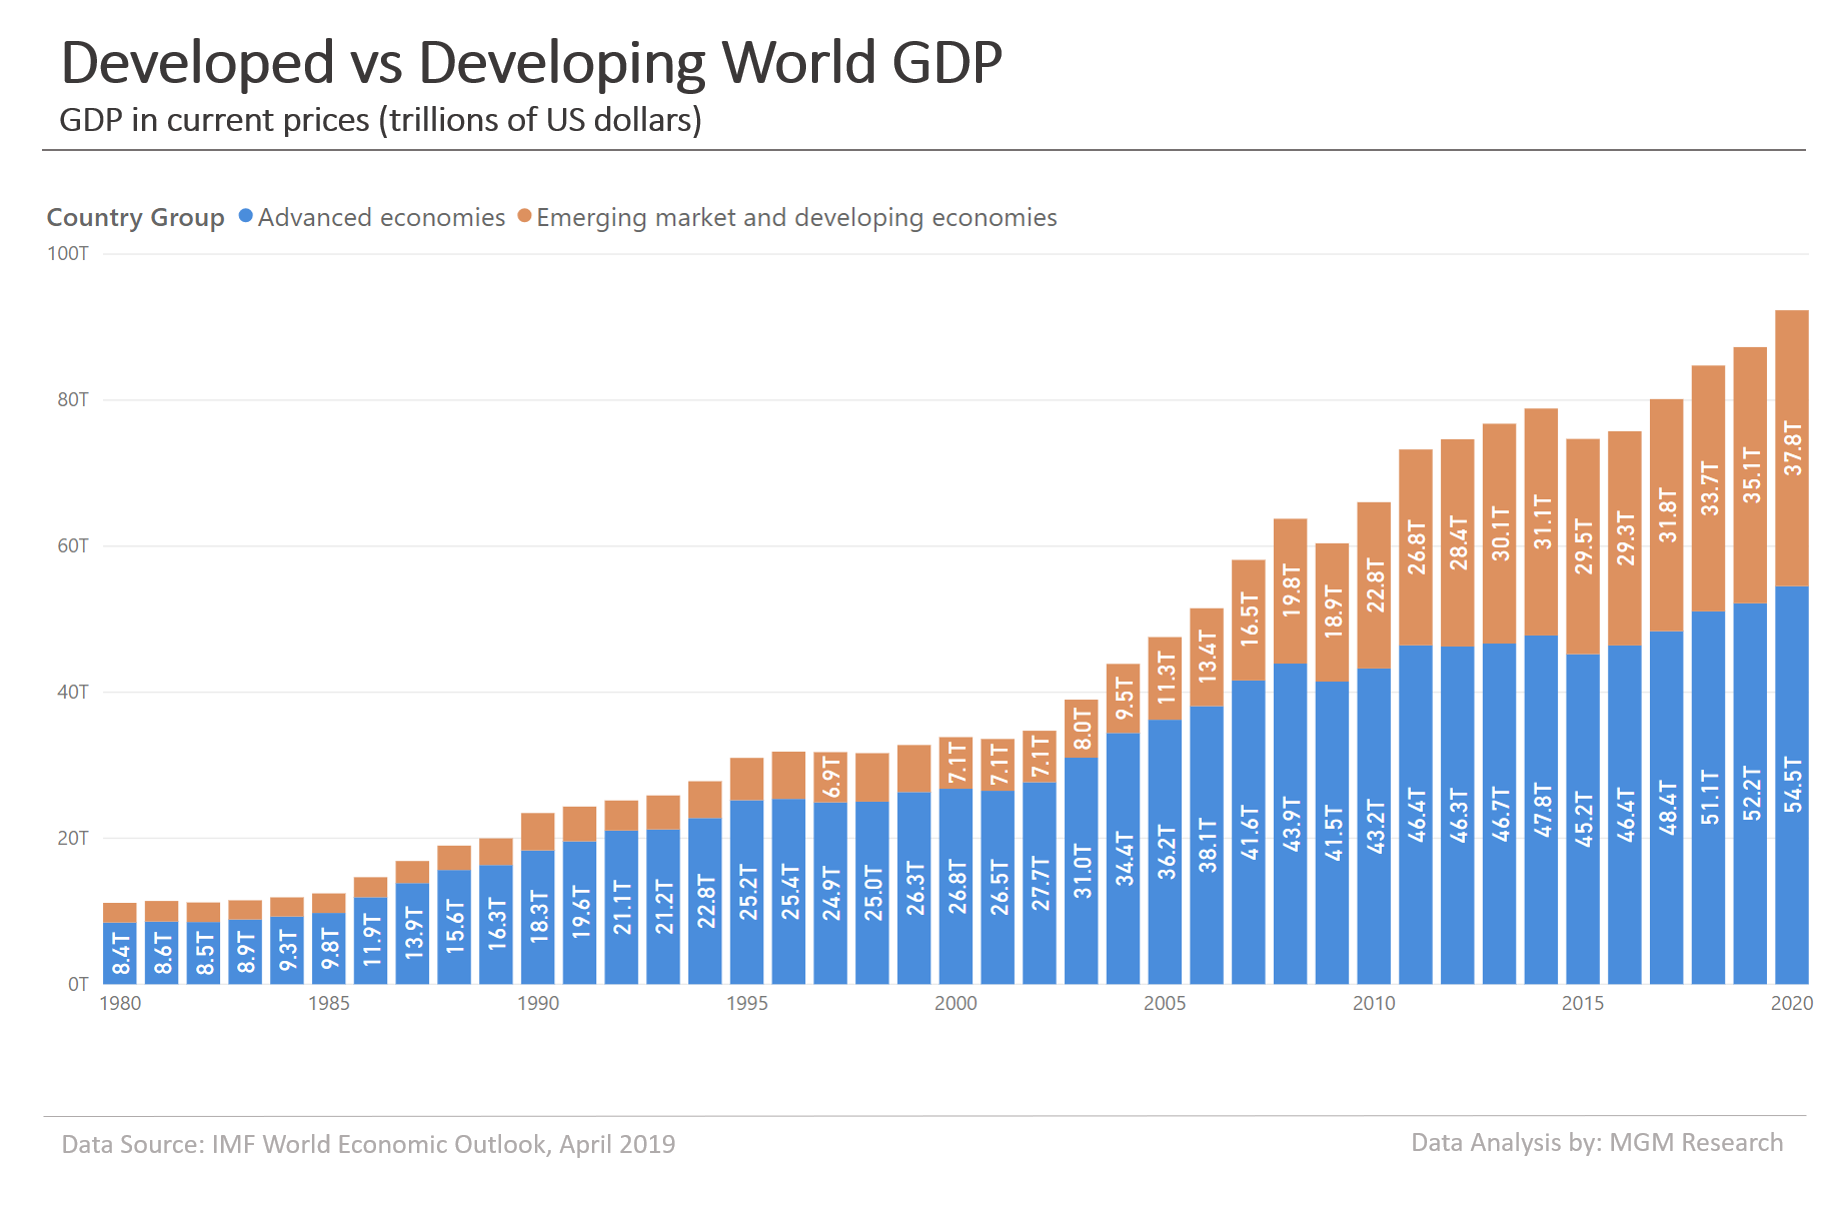
World Total GDP 1980-2020
The world total nominal GDP reached $84.7 trillion during 2018. The total GDP of the developed countries (aka advanced economies) was $51.1 trillion during 2018. The total GDP of the developing countries (aka emerging market and developing economies) was $33.7 trillion during 2018.
IMF estimates the world GDP to reach $87.3 trillion during 2019 and $92.3 trillion during 2020. IMF estimates the developed countries total GDP to reach $52.2 trillion during 2019 and $54.5 trillion during 2020. IMF estimates the developing countries total GDP to reach $35.1 trillion during 2019 and $37.8 trillion during 2020.
The chart below provides the developed vs developing world GDP data from 1980 to 2020.
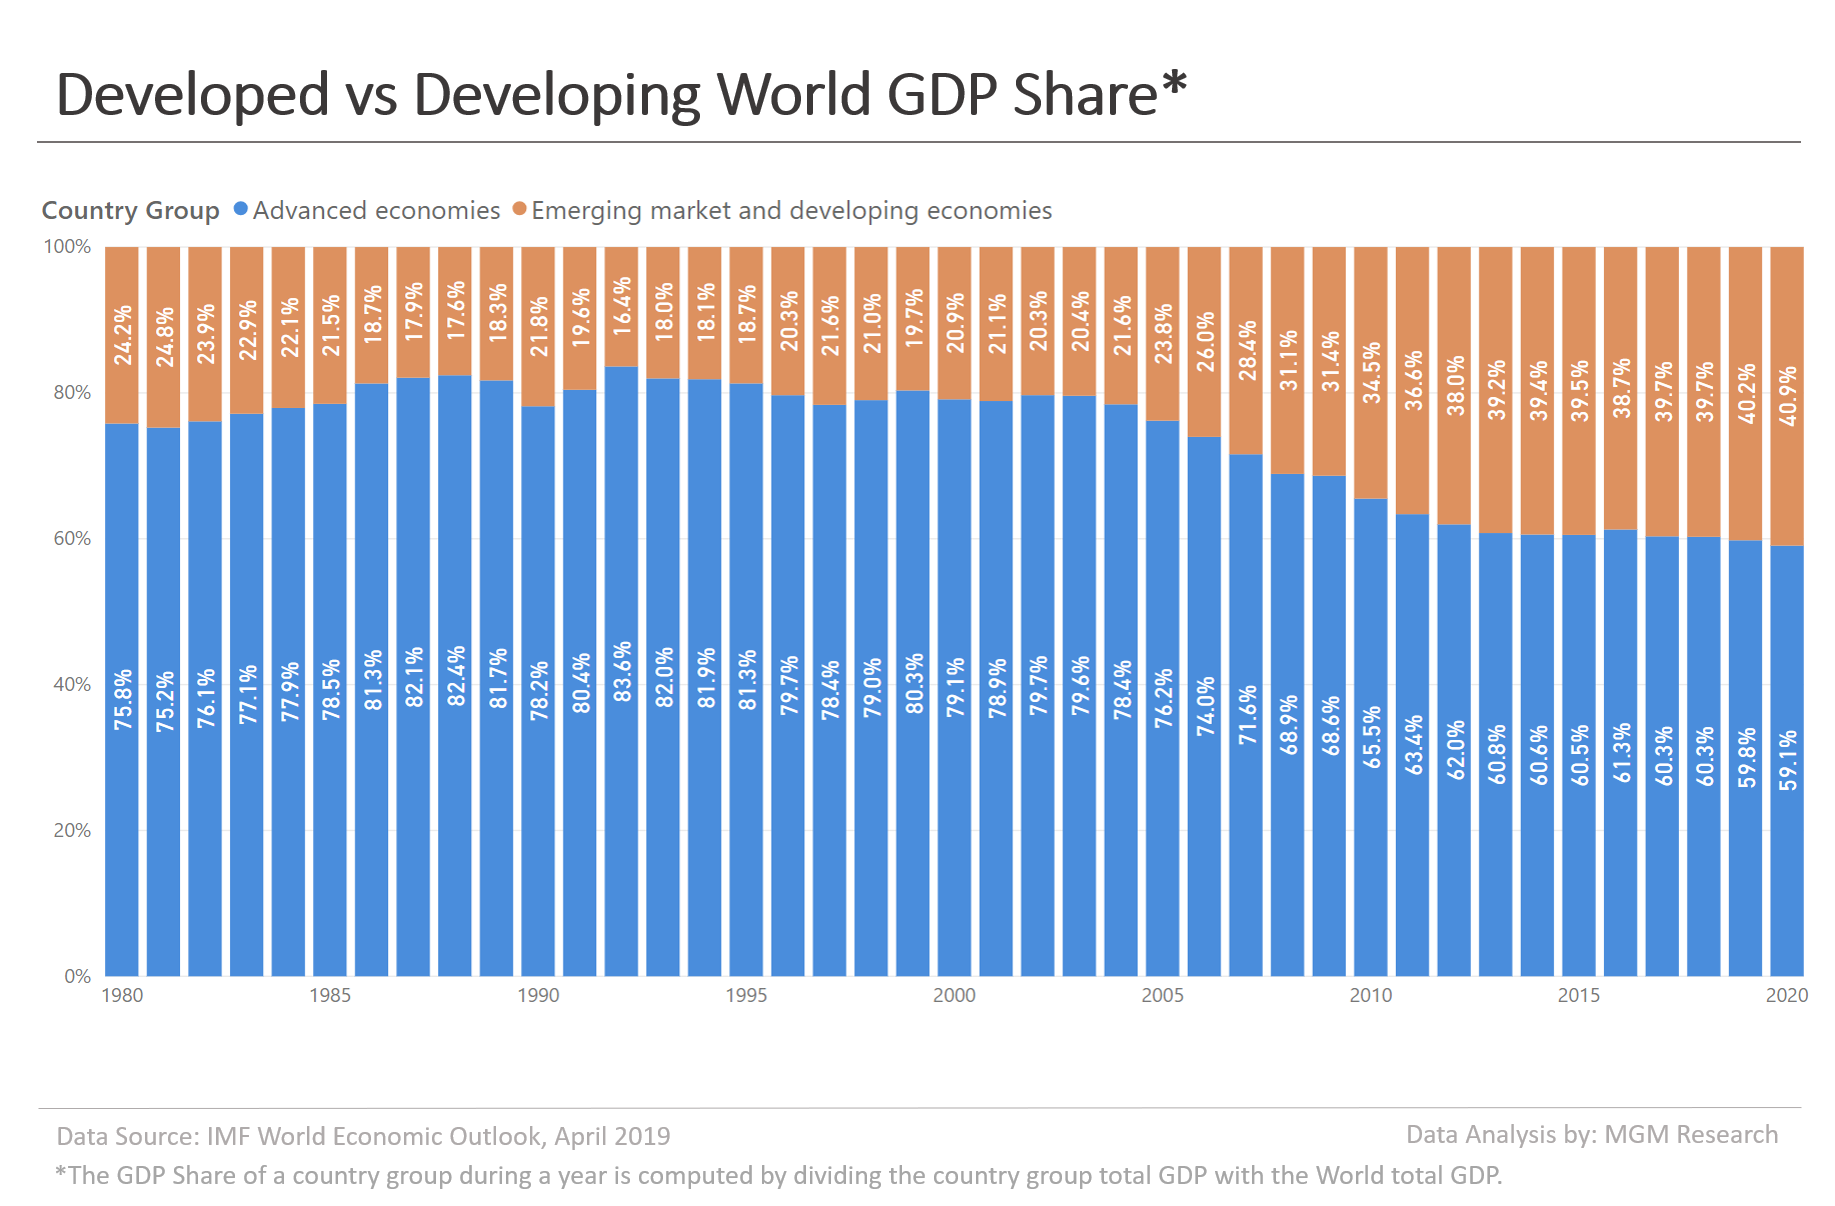
The share of the developed countries in the world total GDP was 60.3% during 2018. The share of the developing countries in the world total GDP was 39.7% during 2018. The share of the developing countries in the world total GDP has been increasing. Twenty years back, during 1999, the share of the developing countries in the world total GDP was 19.7%. So, the share of developing countries in the world total GDP has more than doubled during the past twenty years.
The chart below provides the developed vs developing world GDP share data from 1980 to 2020.
World GDP Ranking
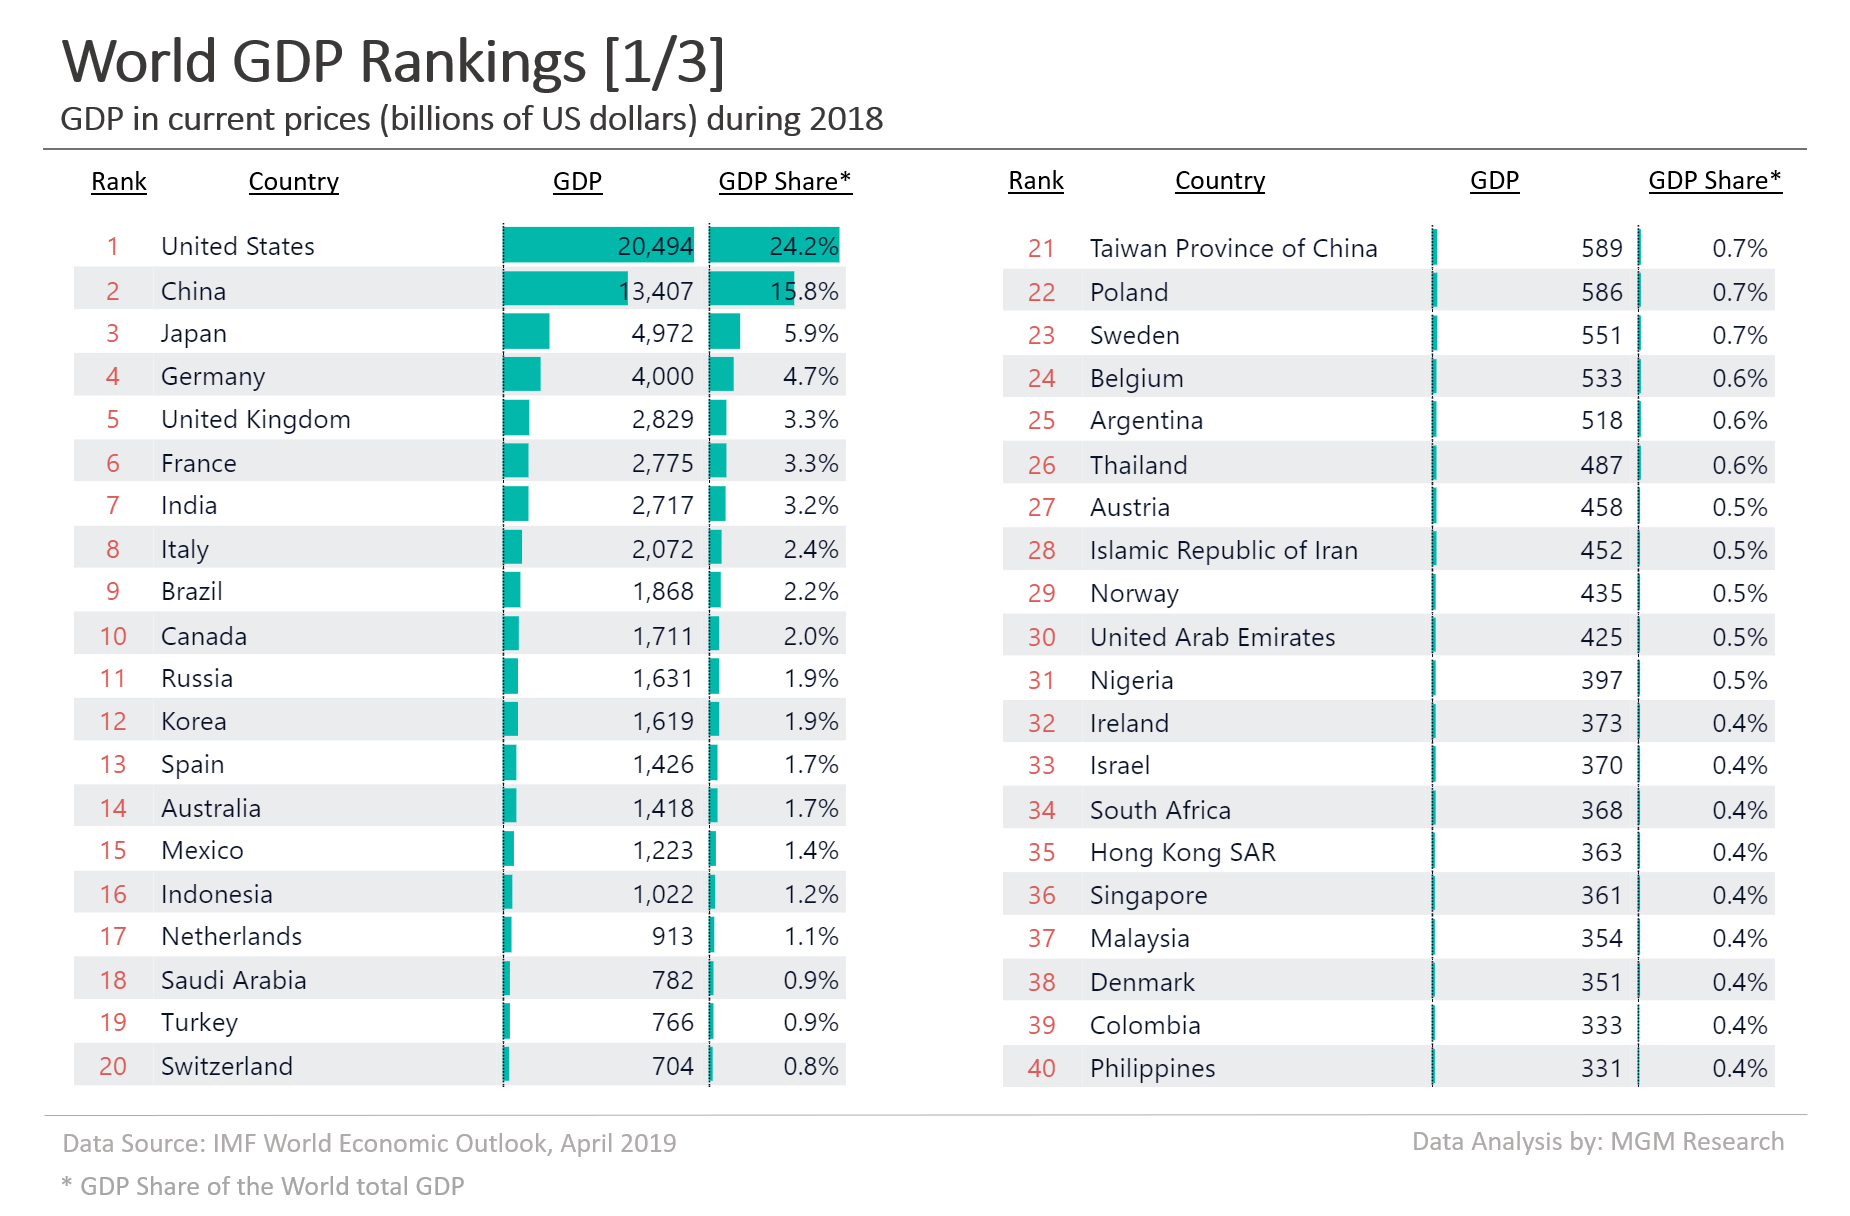
The United States leads the world GDP rankings with 24.2% share of the world total GDP during 2018. The United States is followed by China, Japan, Germany, and the United Kingdom with GDP share of 15.8%, 5.9%, 4.7%, and 3.3% respectively of the world total GDP during 2018. The top-5 countries by GDP account for 53.9% of the world total GDP. The top-10 and top-20 countries account for 67.0% and 80.5% of the world total GDP respectively.
Here are the GDP rankings of the world top-10 economies along with their GDP.
- The United States is ranked 1 with a GDP of $20.5 trillion.
- China is ranked 2 with a GDP of $13.4 trillion.
- Japan is ranked 3 with a GDP of $4.9 trillion.
- Germany is ranked 4 with a GDP of $4.0 trillion.
- The United Kingdom is ranked 5 with a GDP of $2.8 trillion.
- France is ranked 6 with a GDP of $2.8 trillion.
- India is ranked 7 with a GDP of $2.7 trillion.
- Italy is ranked 8 with a GDP of $2.1 trillion.
- Brazil is ranked 9 with a GDP of $1.9 trillion.
- Canada is ranked 10 with a GDP of $1.7 trillion.
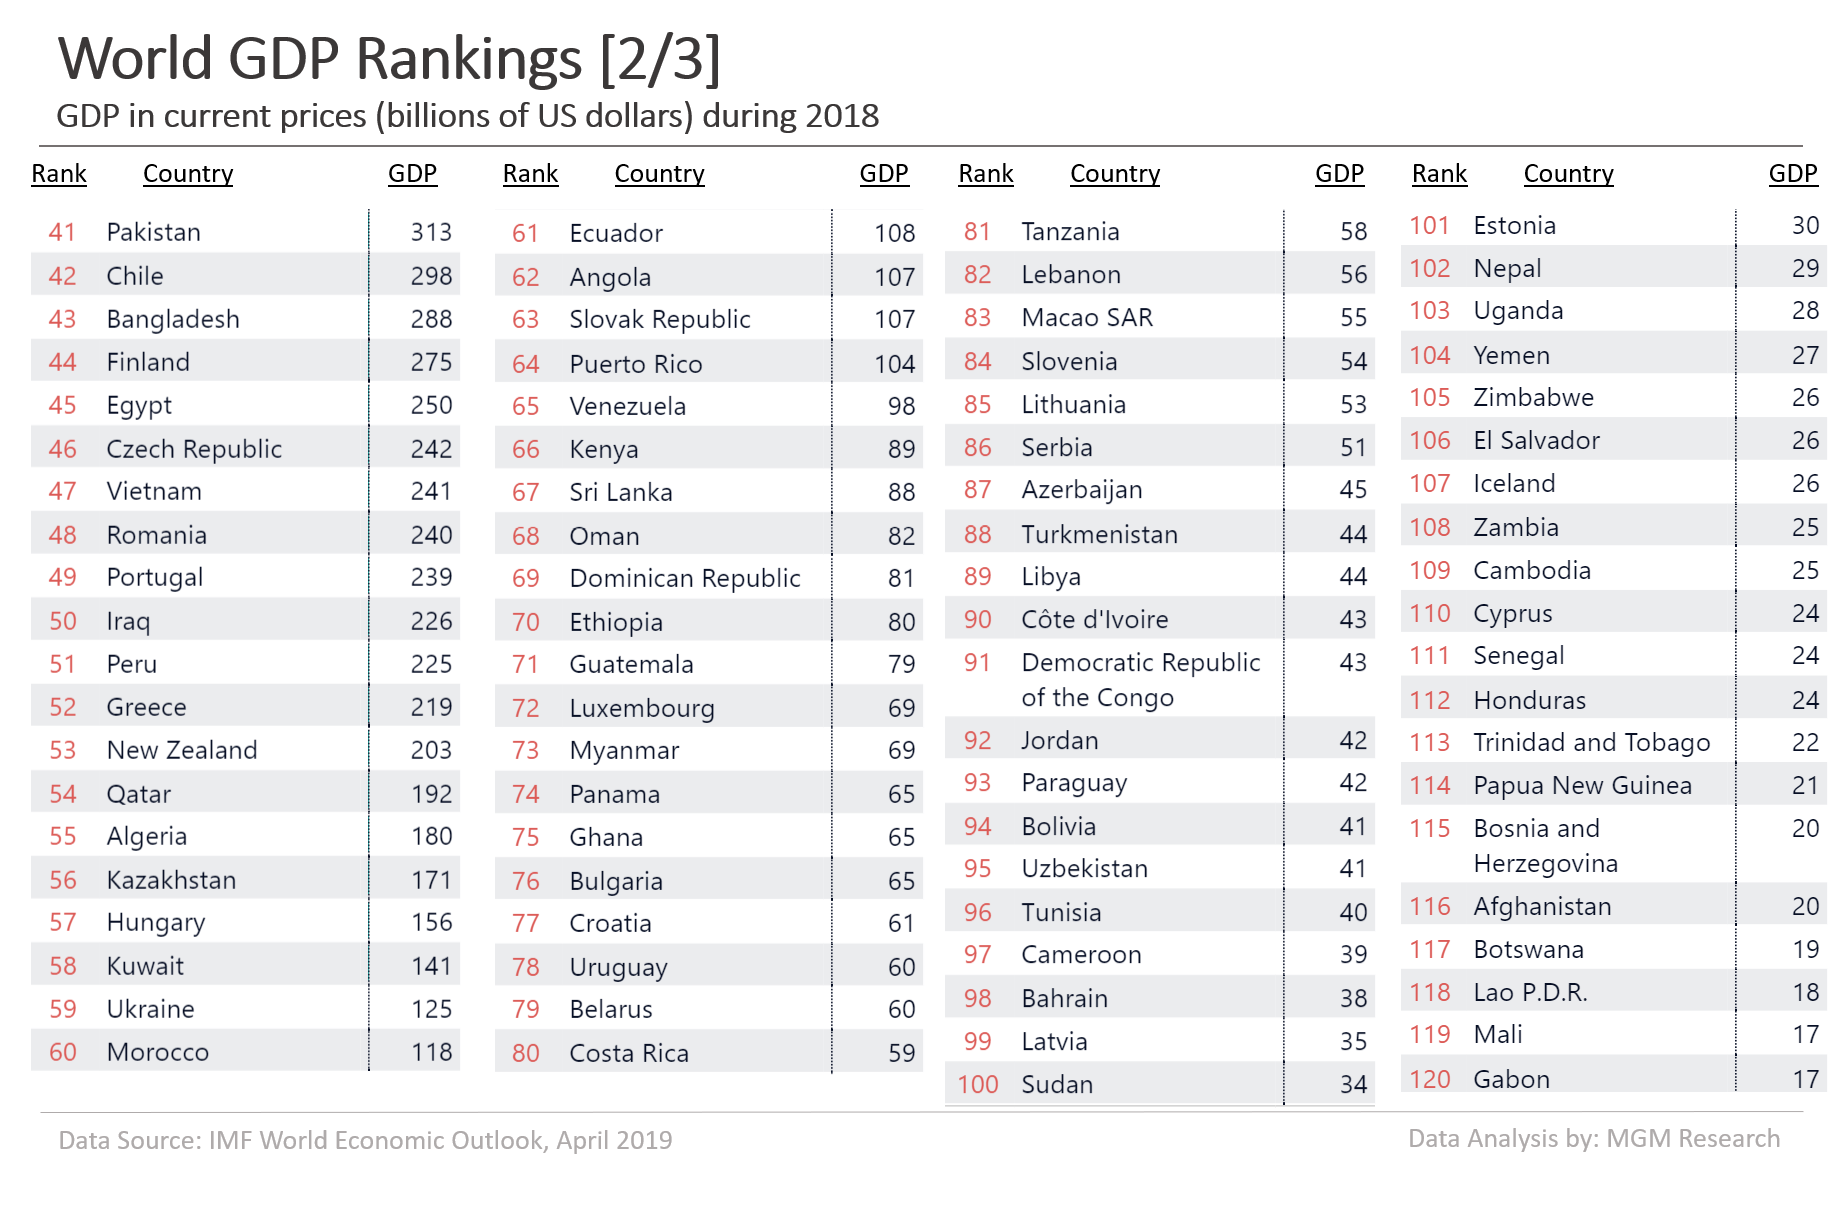
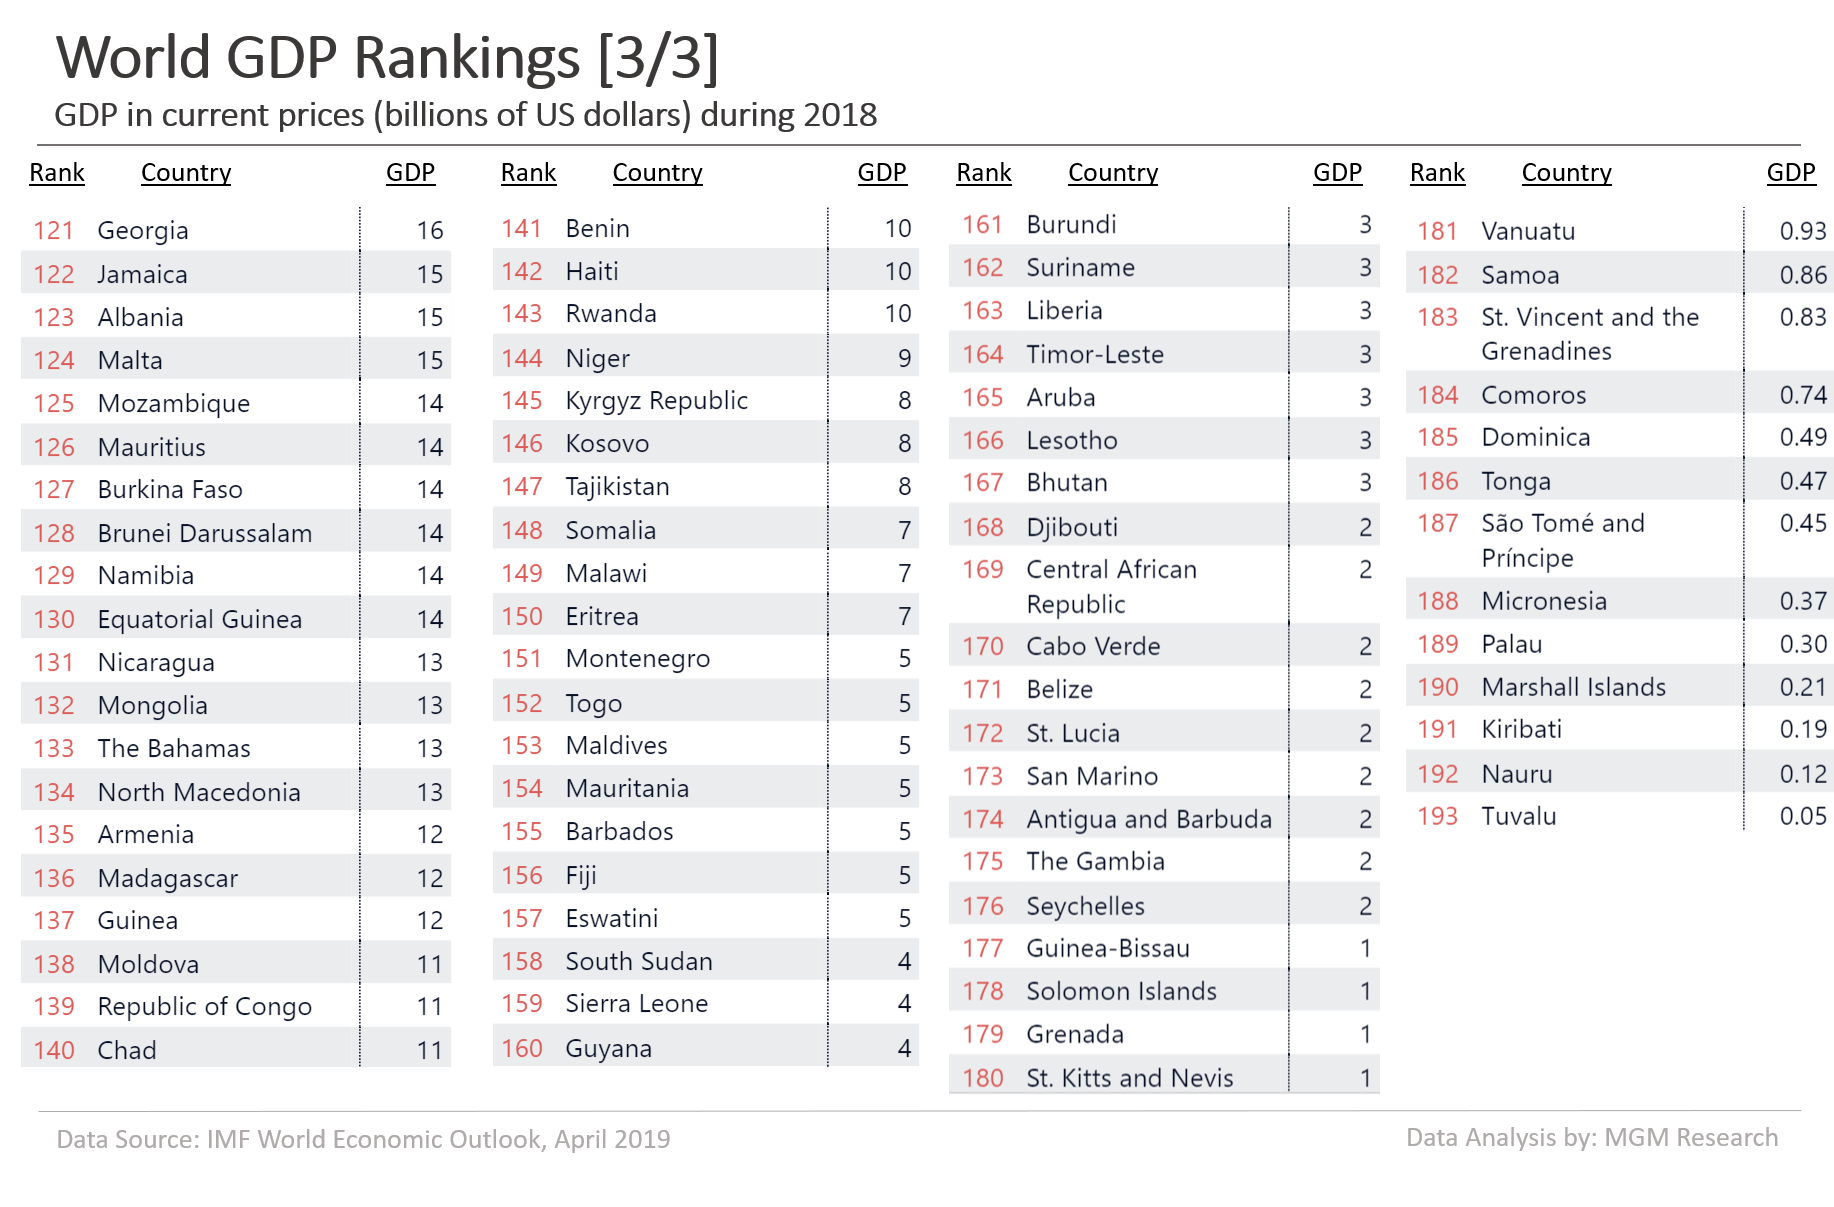
The charts below list all the 193 countries as per their GDP rank.
World GDP Ranking - Developed countries
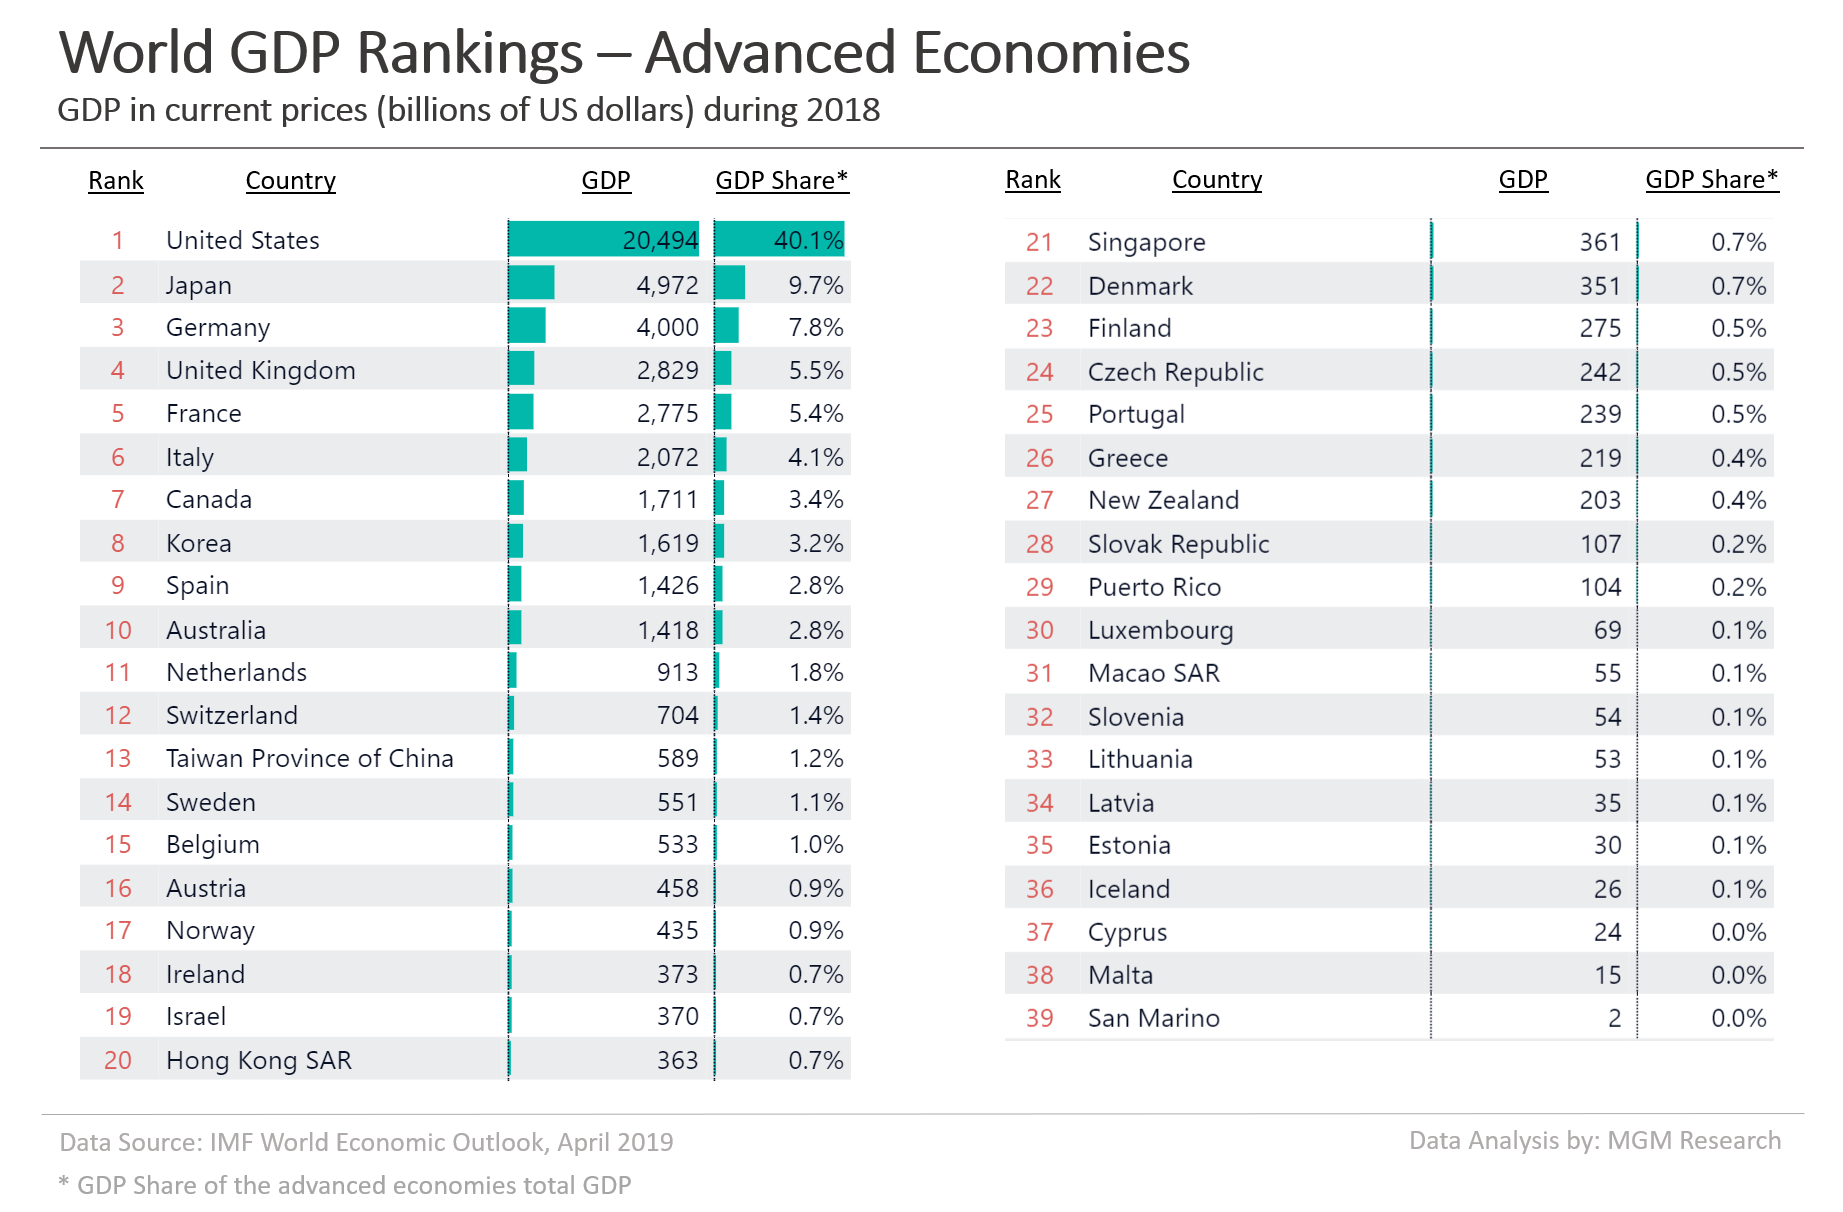
The United States leads the developed world GDP rankings with 40.1% share of the developed world total GDP during 2018. The United States is followed by Japan, Germany, the United Kingdom, and France with GDP share of 9.7%, 7.8%, 5.5%, and 5.4% respectively of the developed world total GDP during 2018. The top-5 countries by GDP account for 68.5% of the developed world total GDP. The top-10 and top-20 countries account for 84.8% and 95.2% of the developed world total GDP respectively. The chart below lists the developed countries as per their GDP rank. The top-7 countries in this list are the G7 (Group of Seven) nations.
World GDP Ranking - Developing countries
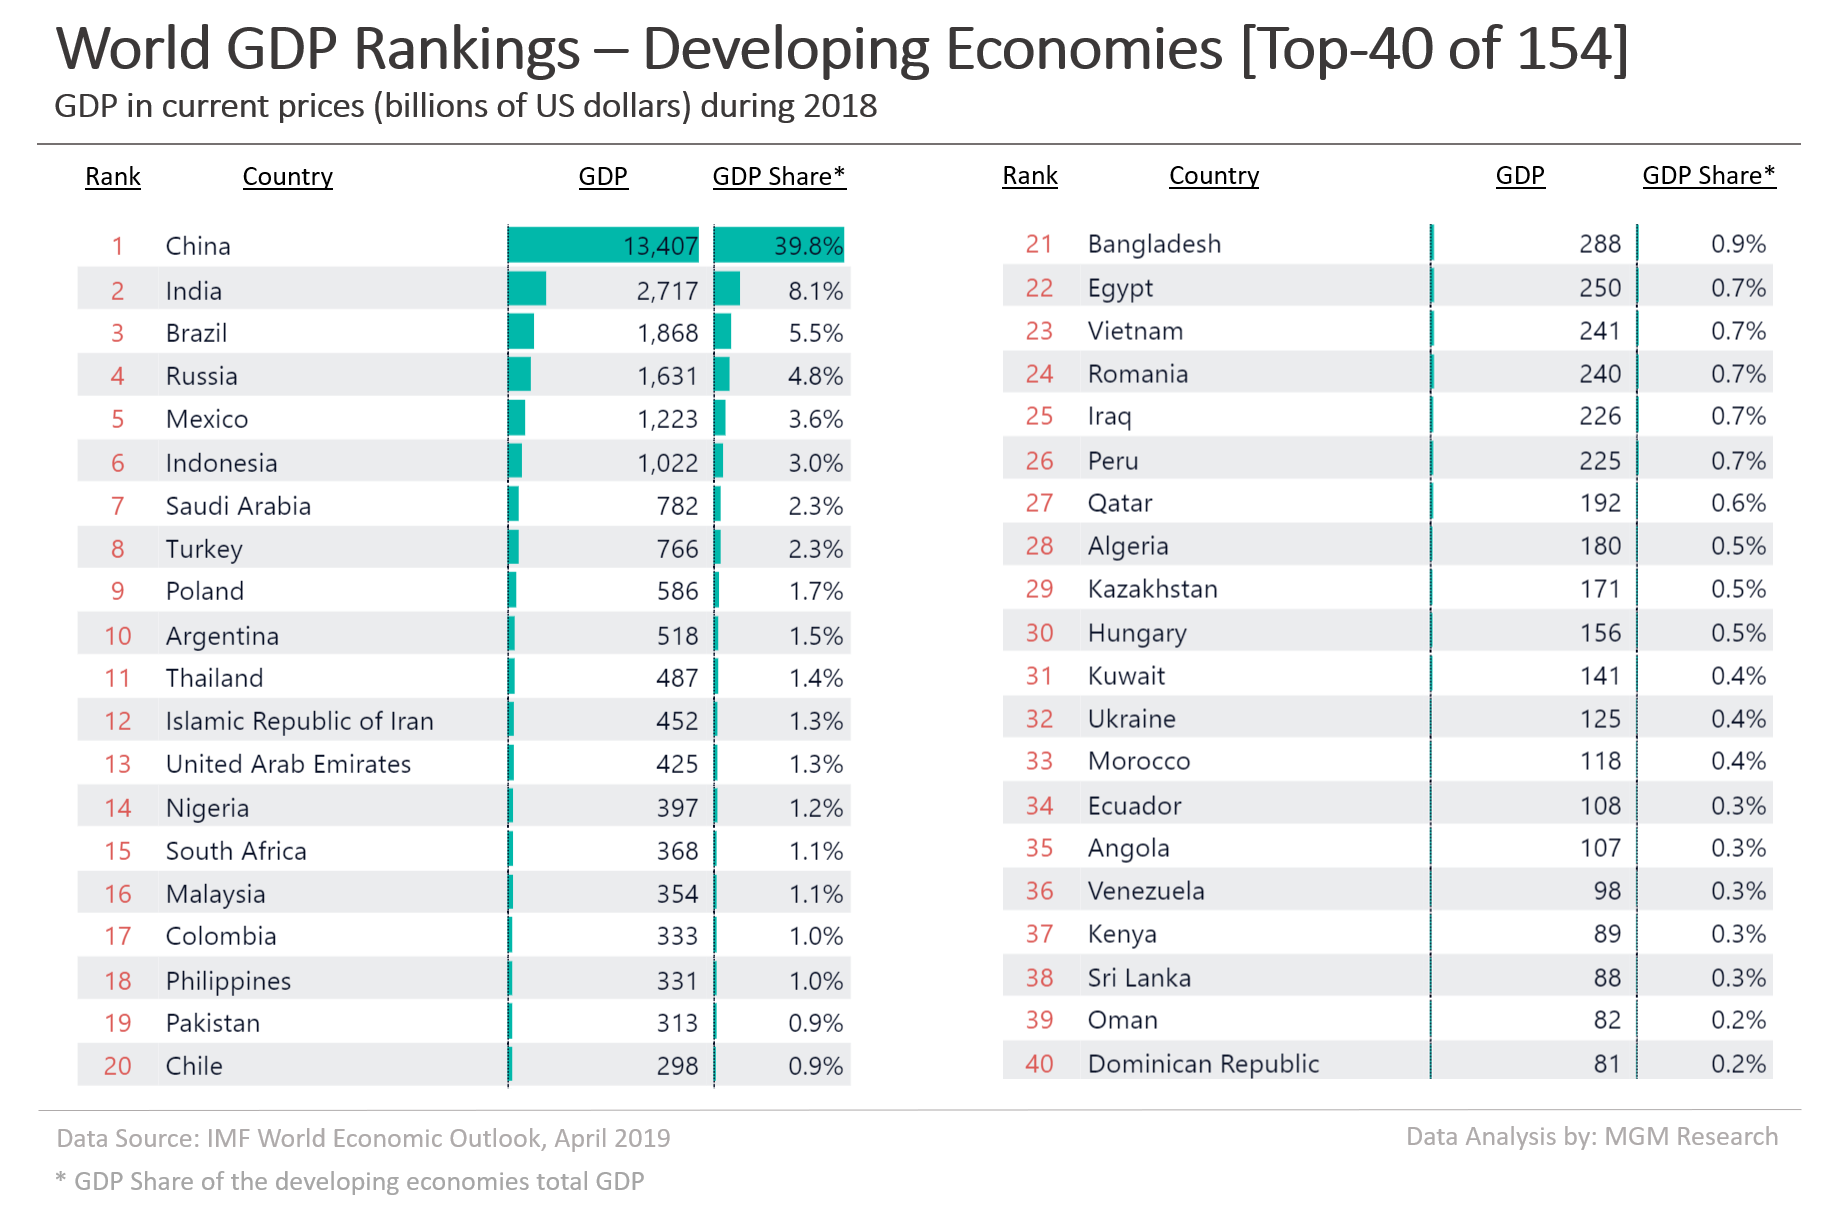
China leads the developing world GDP rankings with 39.8% share of the developing world total GDP during 2018. China is followed by India, Brazil, Russia, and Mexico with GDP share of 8.1%, 5.5%, 4.8%, and 3.6% respectively of the developing world total GDP during 2018. The top-5 countries by GDP account for 61.8% of the developing world total GDP. The top-10 and top-20 countries account for 72.6% and 83.8% of the developing world total GDP respectively. The chart below lists the top-40 developing countries as per their GDP rank. The top-4 countries in this list are the BRIC countries.
World GDP Ranking Data Table
The data table below lists the 193 countries in the world along with their GDP rank, GDP, and GDP share of the world total GDP.
| Rank | Country Name | GDP (in $billions) | World GDP Share |
|---|---|---|---|
| 1 | United States | 20,494 | 24.18% |
| 2 | China | 13,407 | 15.82% |
| 3 | Japan | 4,972 | 5.87% |
| 4 | Germany | 4,000 | 4.72% |
| 5 | United Kingdom | 2,829 | 3.34% |
| 6 | France | 2,775 | 3.28% |
| 7 | India | 2,717 | 3.21% |
| 8 | Italy | 2,072 | 2.45% |
| 9 | Brazil | 1,868 | 2.20% |
| 10 | Canada | 1,711 | 2.02% |
| 11 | Russia | 1,631 | 1.92% |
| 12 | Korea | 1,619 | 1.91% |
| 13 | Spain | 1,426 | 1.68% |
| 14 | Australia | 1,418 | 1.67% |
| 15 | Mexico | 1,223 | 1.44% |
| 16 | Indonesia | 1,022 | 1.21% |
| 17 | Netherlands | 913 | 1.08% |
| 18 | Saudi Arabia | 782 | 0.92% |
| 19 | Turkey | 766 | 0.90% |
| 20 | Switzerland | 704 | 0.83% |
| 21 | Taiwan Province of China | 589 | 0.70% |
| 22 | Poland | 586 | 0.69% |
| 23 | Sweden | 551 | 0.65% |
| 24 | Belgium | 533 | 0.63% |
| 25 | Argentina | 518 | 0.61% |
| 26 | Thailand | 487 | 0.57% |
| 27 | Austria | 458 | 0.54% |
| 28 | Islamic Republic of Iran | 452 | 0.53% |
| 29 | Norway | 435 | 0.51% |
| 30 | United Arab Emirates | 425 | 0.50% |
| 31 | Nigeria | 397 | 0.47% |
| 32 | Ireland | 373 | 0.44% |
| 33 | Israel | 370 | 0.44% |
| 34 | South Africa | 368 | 0.43% |
| 35 | Hong Kong SAR | 363 | 0.43% |
| 36 | Singapore | 361 | 0.43% |
| 37 | Malaysia | 354 | 0.42% |
| 38 | Denmark | 351 | 0.41% |
| 39 | Colombia | 333 | 0.39% |
| 40 | Philippines | 331 | 0.39% |
| 41 | Pakistan | 313 | 0.37% |
| 42 | Chile | 298 | 0.35% |
| 43 | Bangladesh | 288 | 0.34% |
| 44 | Finland | 275 | 0.32% |
| 45 | Egypt | 250 | 0.29% |
| 46 | Czech Republic | 242 | 0.29% |
| 47 | Vietnam | 241 | 0.28% |
| 48 | Romania | 240 | 0.28% |
| 49 | Portugal | 239 | 0.28% |
| 50 | Iraq | 226 | 0.27% |
| 51 | Peru | 225 | 0.27% |
| 52 | Greece | 219 | 0.26% |
| 53 | New Zealand | 203 | 0.24% |
| 54 | Qatar | 192 | 0.23% |
| 55 | Algeria | 180 | 0.21% |
| 56 | Kazakhstan | 171 | 0.20% |
| 57 | Hungary | 156 | 0.18% |
| 58 | Kuwait | 141 | 0.17% |
| 59 | Ukraine | 125 | 0.15% |
| 60 | Morocco | 118 | 0.14% |
| 61 | Ecuador | 108 | 0.13% |
| 62 | Angola | 107 | 0.13% |
| 63 | Slovak Republic | 107 | 0.13% |
| 64 | Puerto Rico | 104 | 0.12% |
| 65 | Venezuela | 98 | 0.12% |
| 66 | Kenya | 89 | 0.11% |
| 67 | Sri Lanka | 88 | 0.10% |
| 68 | Oman | 82 | 0.10% |
| 69 | Dominican Republic | 81 | 0.10% |
| 70 | Ethiopia | 80 | 0.09% |
| 71 | Guatemala | 79 | 0.09% |
| 72 | Luxembourg | 69 | 0.08% |
| 73 | Myanmar | 69 | 0.08% |
| 74 | Panama | 65 | 0.08% |
| 75 | Ghana | 65 | 0.08% |
| 76 | Bulgaria | 65 | 0.08% |
| 77 | Croatia | 61 | 0.07% |
| 78 | Uruguay | 60 | 0.07% |
| 79 | Belarus | 60 | 0.07% |
| 80 | Costa Rica | 59 | 0.07% |
| 81 | Tanzania | 58 | 0.07% |
| 82 | Lebanon | 56 | 0.07% |
| 83 | Macao SAR | 55 | 0.06% |
| 84 | Slovenia | 54 | 0.06% |
| 85 | Lithuania | 53 | 0.06% |
| 86 | Serbia | 51 | 0.06% |
| 87 | Azerbaijan | 45 | 0.05% |
| 88 | Turkmenistan | 44 | 0.05% |
| 89 | Libya | 44 | 0.05% |
| 90 | Côte d'Ivoire | 43 | 0.05% |
| 91 | Democratic Republic of the Congo | 43 | 0.05% |
| 92 | Jordan | 42 | 0.05% |
| 93 | Paraguay | 42 | 0.05% |
| 94 | Bolivia | 41 | 0.05% |
| 95 | Uzbekistan | 41 | 0.05% |
| 96 | Tunisia | 40 | 0.05% |
| 97 | Cameroon | 39 | 0.05% |
| 98 | Bahrain | 38 | 0.05% |
| 99 | Latvia | 35 | 0.04% |
| 100 | Sudan | 34 | 0.04% |
| 101 | Estonia | 30 | 0.04% |
| 102 | Nepal | 29 | 0.03% |
| 103 | Uganda | 28 | 0.03% |
| 104 | Yemen | 27 | 0.03% |
| 105 | Zimbabwe | 26 | 0.03% |
| 106 | El Salvador | 26 | 0.03% |
| 107 | Iceland | 26 | 0.03% |
| 108 | Zambia | 25 | 0.03% |
| 109 | Cambodia | 25 | 0.03% |
| 110 | Cyprus | 24 | 0.03% |
| 111 | Senegal | 24 | 0.03% |
| 112 | Honduras | 24 | 0.03% |
| 113 | Trinidad and Tobago | 22 | 0.03% |
| 114 | Papua New Guinea | 21 | 0.03% |
| 115 | Bosnia and Herzegovina | 20 | 0.02% |
| 116 | Afghanistan | 20 | 0.02% |
| 117 | Botswana | 19 | 0.02% |
| 118 | Lao P.D.R. | 18 | 0.02% |
| 119 | Mali | 17 | 0.02% |
| 120 | Gabon | 17 | 0.02% |
| 121 | Georgia | 16 | 0.02% |
| 122 | Jamaica | 15 | 0.02% |
| 123 | Albania | 15 | 0.02% |
| 124 | Malta | 15 | 0.02% |
| 125 | Mozambique | 14 | 0.02% |
| 126 | Mauritius | 14 | 0.02% |
| 127 | Burkina Faso | 14 | 0.02% |
| 128 | Brunei Darussalam | 14 | 0.02% |
| 129 | Namibia | 14 | 0.02% |
| 130 | Equatorial Guinea | 14 | 0.02% |
| 131 | Nicaragua | 13 | 0.02% |
| 132 | Mongolia | 13 | 0.02% |
| 133 | The Bahamas | 13 | 0.02% |
| 134 | North Macedonia | 13 | 0.01% |
| 135 | Armenia | 12 | 0.01% |
| 136 | Madagascar | 12 | 0.01% |
| 137 | Guinea | 12 | 0.01% |
| 138 | Moldova | 11 | 0.01% |
| 139 | Republic of Congo | 11 | 0.01% |
| 140 | Chad | 11 | 0.01% |
| 141 | Benin | 10 | 0.01% |
| 142 | Haiti | 10 | 0.01% |
| 143 | Rwanda | 10 | 0.01% |
| 144 | Niger | 9 | 0.01% |
| 145 | Kyrgyz Republic | 8 | 0.01% |
| 146 | Kosovo | 8 | 0.01% |
| 147 | Tajikistan | 8 | 0.01% |
| 148 | Somalia | 7 | 0.01% |
| 149 | Malawi | 7 | 0.01% |
| 150 | Eritrea | 7 | 0.01% |
| 151 | Montenegro | 5 | 0.01% |
| 152 | Togo | 5 | 0.01% |
| 153 | Maldives | 5 | 0.01% |
| 154 | Mauritania | 5 | 0.01% |
| 155 | Barbados | 5 | 0.01% |
| 156 | Fiji | 5 | 0.01% |
| 157 | Eswatini | 5 | 0.01% |
| 158 | South Sudan | 4 | 0.01% |
| 159 | Sierra Leone | 4 | 0.01% |
| 160 | Guyana | 4 | 0.004% |
| 161 | Burundi | 3 | 0.004% |
| 162 | Suriname | 3 | 0.004% |
| 163 | Liberia | 3 | 0.004% |
| 164 | Timor-Leste | 3 | 0.004% |
| 165 | Aruba | 3 | 0.003% |
| 166 | Lesotho | 3 | 0.003% |
| 167 | Bhutan | 3 | 0.003% |
| 168 | Djibouti | 2 | 0.003% |
| 169 | Central African Republic | 2 | 0.003% |
| 170 | Cabo Verde | 2 | 0.002% |
| 171 | Belize | 2 | 0.002% |
| 172 | St. Lucia | 2 | 0.002% |
| 173 | San Marino | 2 | 0.002% |
| 174 | Antigua and Barbuda | 2 | 0.002% |
| 175 | The Gambia | 2 | 0.002% |
| 176 | Seychelles | 2 | 0.002% |
| 177 | Guinea-Bissau | 1 | 0.002% |
| 178 | Solomon Islands | 1 | 0.002% |
| 179 | Grenada | 1 | 0.001% |
| 180 | St. Kitts and Nevis | 1 | 0.001% |
| 181 | Vanuatu | 1 | 0.001% |
| 182 | Samoa | 1 | 0.001% |
| 183 | St. Vincent and the Grenadines | 1 | 0.001% |
| 184 | Comoros | 1 | 0.001% |
| 185 | Dominica | 0.5 | 0.001% |
| 186 | Tonga | 0.5 | 0.001% |
| 187 | São Tomé and Príncipe | 0.4 | 0.001% |
| 188 | Micronesia | 0.4 | 0.0004% |
| 189 | Palau | 0.3 | 0.0004% |
| 190 | Marshall Islands | 0.2 | 0.0003% |
| 191 | Kiribati | 0.2 | 0.0002% |
| 192 | Nauru | 0.1 | 0.0001% |
| 193 | Tuvalu | 0.05 | 0.0001% |
Notes
1. Data Source: International Monetary Fund (IMF) World Economic Outlook (WEO) database, April 2019 edition.
2. How does the WEO categorize advanced versus emerging market and developing economies? As per IMF, “The main criteria used by the WEO to classify the world into advanced economies and emerging market and developing economies are (1) per capita income level, (2) export diversification, and (3) degree of integration into the global financial system. Note, however, that these are not the only factors considered in deciding the classification of countries. This classification has evolved over time. The objective is to facilitate analysis by providing a reasonably meaningful method of organizing data. Reclassification only happens when something marked changes or the case for change in terms of the three criteria above becomes overwhelming.”