IMF (International Monetary Fund) released their latest data for world real GDP growth on June 24, 2020. IMF releases update to its World Economic Outlook (WEO) database four times in a year. During April and October, IMF releases major updates that provide the data for most of the economic indicators for 194 countries. During June/July and December/January, IMF releases minor updates that provide the data for few indicators for select large economies.
In the June 2020 update, IMF released its latest real GDP growth forecast for 30 countries. Earlier, IMF used to provide the data for only 16 countries in WEO minor updates. In this article, we will look at the IMF latest real GDP growth forecast for the year 2020. We will look at how IMF has kept revising its real GDP growth forecast for different countries and regions/groups during WEO last four updates.
IMF Real GDP Growth Forecast Revisions
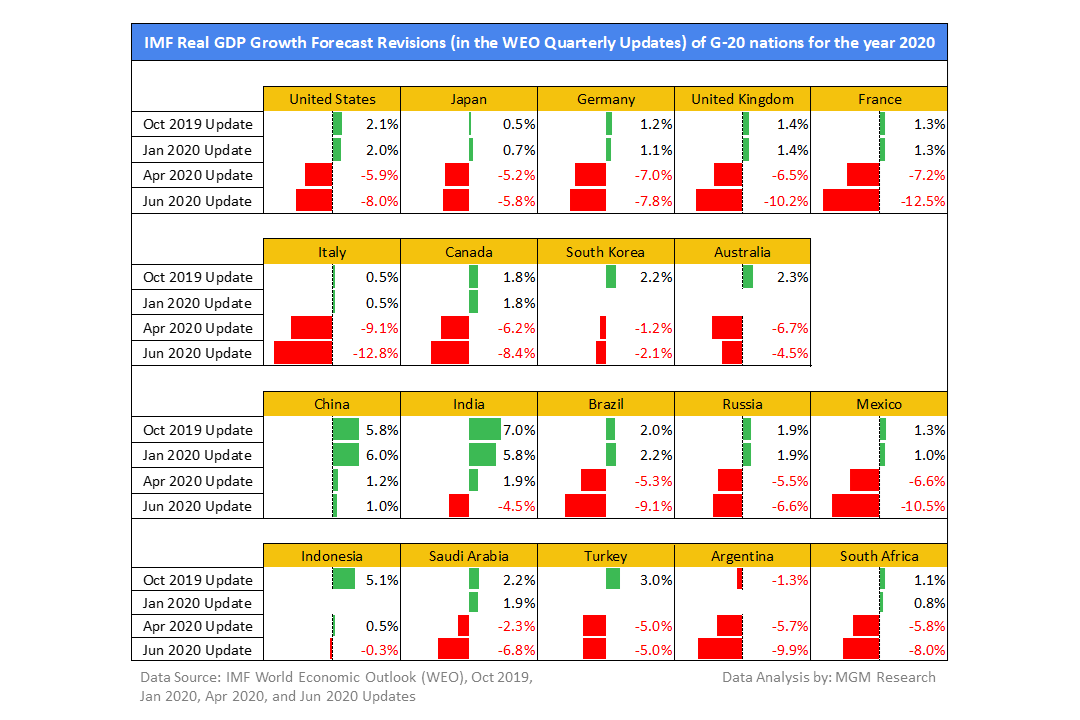
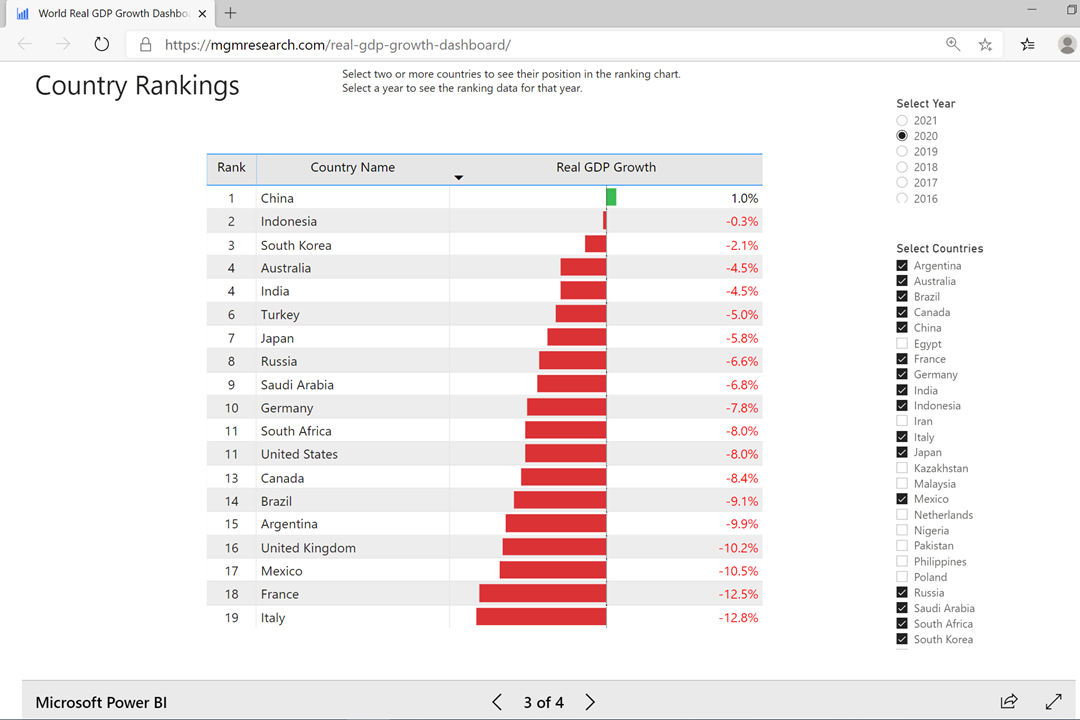
In the WEO October 2019 update, when Covid-19 pandemic had not started, IMF estimated the global economy growth to be 3.4% during 2020. In the January 2020 update, IMF revised it slightly down to 3.0%. In the April 2019 update, when the Covid-19 pandemic was growing in many countries, IMF revised down the global GDP growth to -3.0%. The real GDP growth numbers looked bad then. In the June 2019 update, the real GDP growth numbers have gone from bad to worse. IMF has revised down the global GDP growth to -4.9%. The following charts show the IMF revisions to real GDP growth numbers for the year 2020 for different regions or country groups during the last four IMF WEO updates.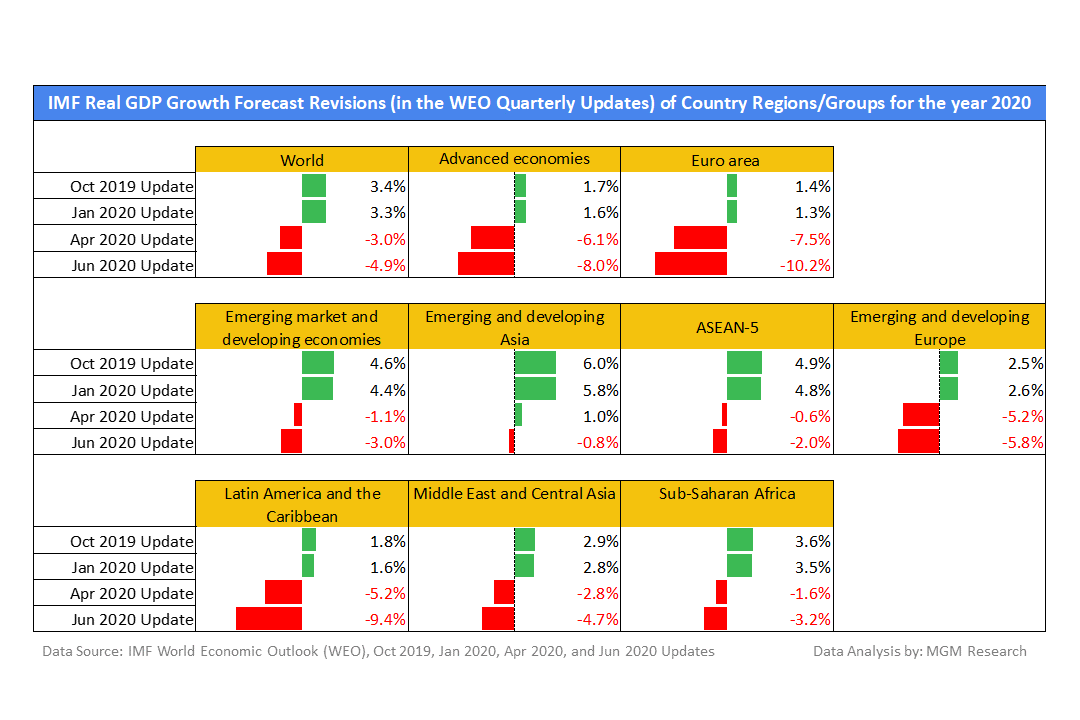 Let us look at the revisions to real GDP growth forecast of the United States (US), the world’s largest economy. In the October 2019 update, IMF estimated that the US economy growth would be 2.1% during 2020. In the January 2020 update, IMF estimated that the US real GDP growth would be 2.0%. In the April 2020, IMF revised down the US GDP growth to -5.9%. In the June 2020 update, IMF revised it down further to -8.0%. Clearly, the real GDP growth projections have gone from bad to worse for the US. In fact, the real GDP growth numbers have gone from bad to worse for most of the economies in the world, whether they are advanced or emerging. The following charts show the revisions to the real GDP growth numbers for the year 2020 for the G20 (Group of Twenty) countries during the last four IMF WEO updates.
Real GDP Growth from 1980 to 2020
Until last year, IMF used to provide a five-year forecast for its economy data. In April 2020, IMF provided forecast data only for the years 2020 and 2021. The forecasts in April 2020 did not hold even for three months because higher-than-usual degree of uncertainty. That is why IMF slashed its GDP growth forecast in the June 2020 update. The real shock to the global economies becomes visible when we compare the 2020 real GDP growth numbers with the numbers in the past. As an example, look at the world GDP growth from 1980 to 2020 in the chart below. The world GDP growth looks awfully bad in 2020, as compared to any of the previous years.
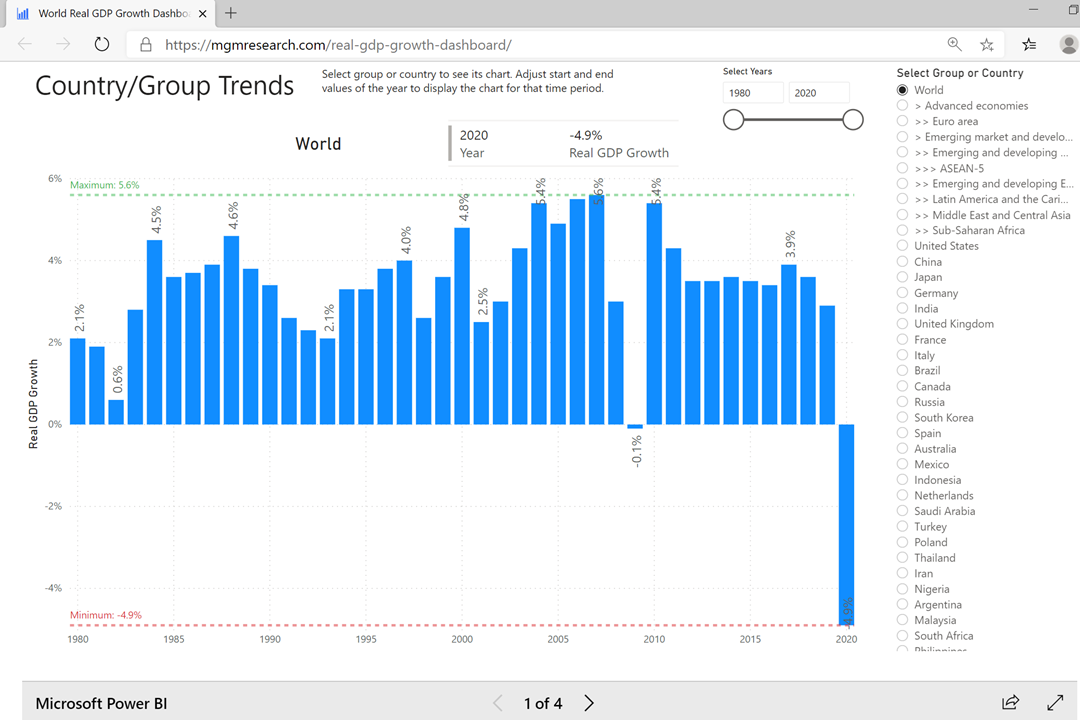
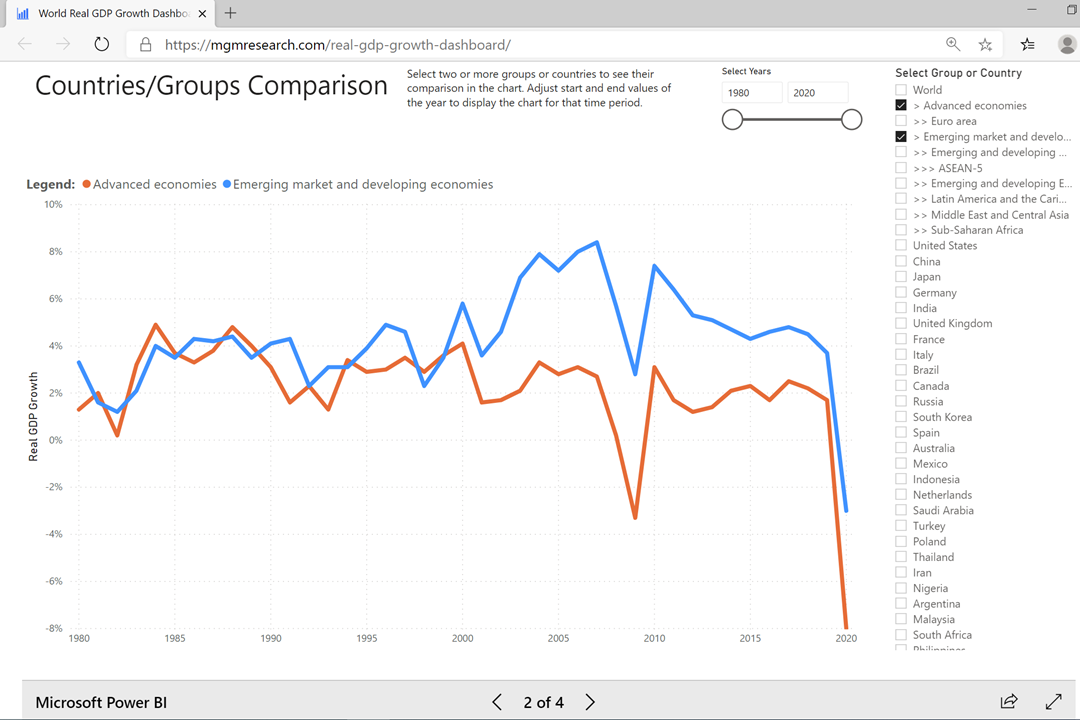
IMF forecasts that world GDP growth would decline by -4.9% in 2020. The world economy comprises of two country groups: Advanced economies and emerging market and developing economies. IMF forecasts that the advanced economies GDP growth would decline by -8.0% in 2020. Emerging market and developing economies, which had never seen a negative GDP growth in the past, would see GDP growth decline by -3.0% in 2020. The chart below compares the real GDP growth of the two country groups from 1980 to 2020.
Among the advanced economies, Italy and Spain are the worst affected. Their real GDP growth is estimated to decline by -12.8% during 2020. Among the emerging market and developing economies, Mexico is the worst affected. Mexico real GDP growth is estimated to decline by -10.5% during 2020. The following chart shows the real GDP growth forecast of the G20 economies for the year 2020.
Will there be further downward revisions in the IMF real GDP growth forecasts?
We believe that IMF will further revise its real GDP growth forecast downwards in the WEO October 2020 update. The global economy growth numbers have already gone from bad to worse. But the worse is not over yet. As per IMF, “There has been an unprecedented decline in the global economic activity due to the Covid-19 pandemic.” We will see more impact of the slumping consumer demand, collapse of cross-border tourism, weak global trade activity, global supply-chain disruptions, business closures, and job losses in the coming months.
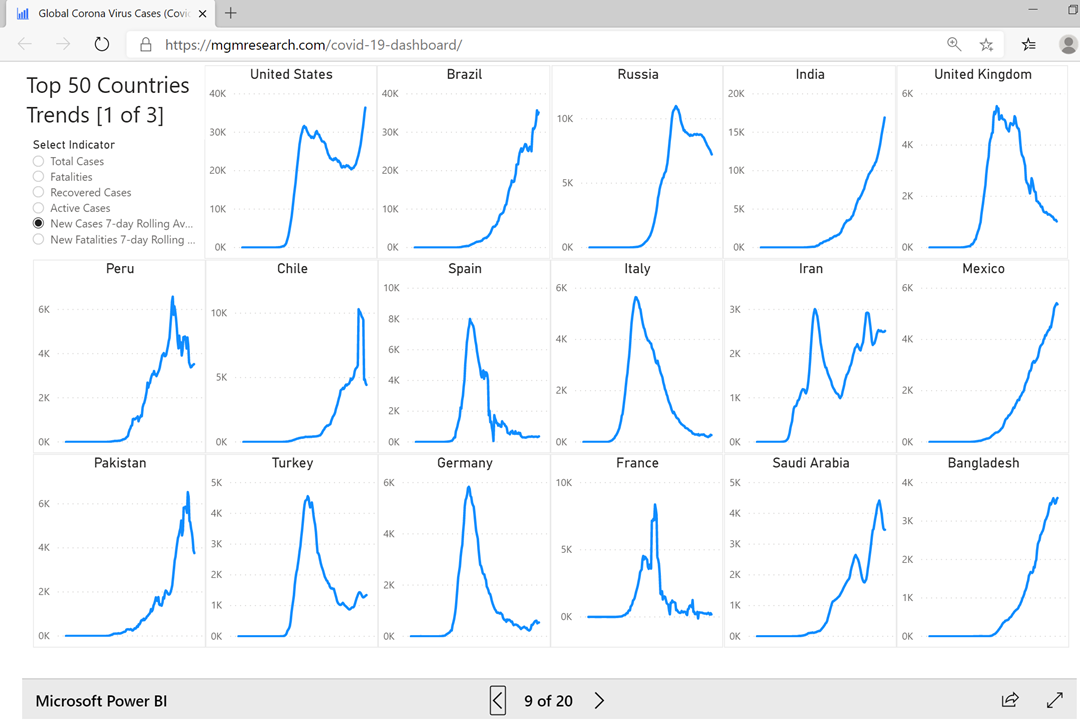
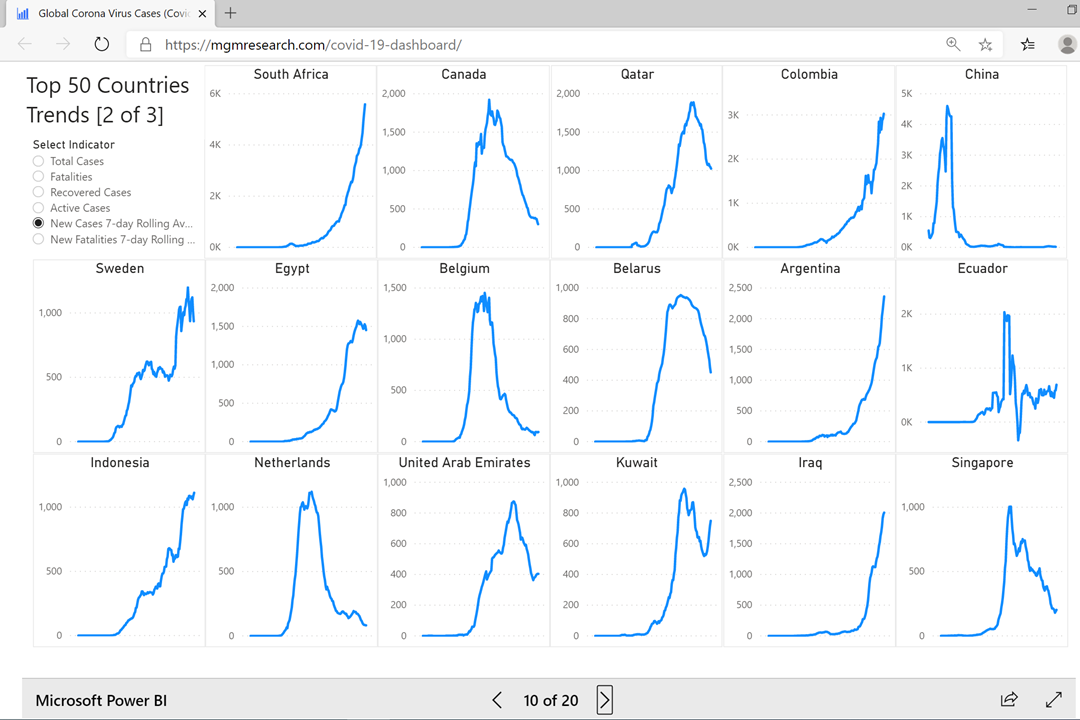
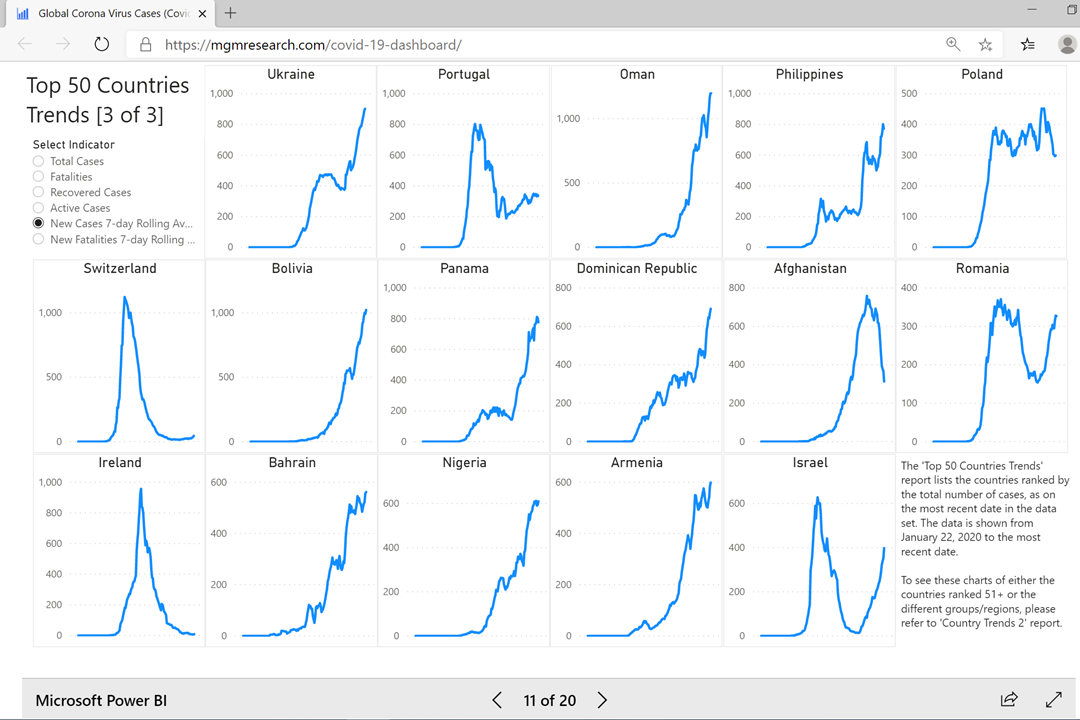
The Covid-19 pandemic is not yet over. Nobody knows when it will be over. Our global corona virus cases dashboard shows that the new corona virus cases are still rising in many countries. While peak has reached in many of the European nations such as Germany, Italy, and Spain, the cases are still growing in many nations across Latin America, South Asia, Middle East, and Africa. The following charts from our covid-19 dashboard show the growth of corona virus new cases across the top-50 countries by the total number of corona virus cases. Each of the chart has the data from January 22, 2020 to June 27, 2020.
World Real GDP Growth Dashboard
Most of the charts in this article are generated using our online dashboard for the world real GDP growth. The dashboard provides the charts for the real GDP growth of 30 countries and 10 regions, whose data is available in the IMF WEO June 2020 update, for the years 1980 to 2021.
If you are interested in analyzing the real GDP growth of a country or comparing the real GDP growth for two or more countries or regions for any number of years in the past 40 years, then, please visit our real GDP growth online dashboard.