In this article, we will compare the United States (US) and India on several GDP (Gross Domestic Product) indicators such as nominal GDP, GDP per capita, GDP PPP (Purchasing Power Parity), GDP PPP per capita, GDP PPP share of the world total GDP PPP, real GDP growth, and GDP sector composition. We will provide 10 charts comparing the US and India GDP indicators data for the 40-year period from 1980 to 2020. We will compare the US and India using the GDP indicators data from IMF (International Monetary Fund).
United States vs India - GDP Indicators Summary
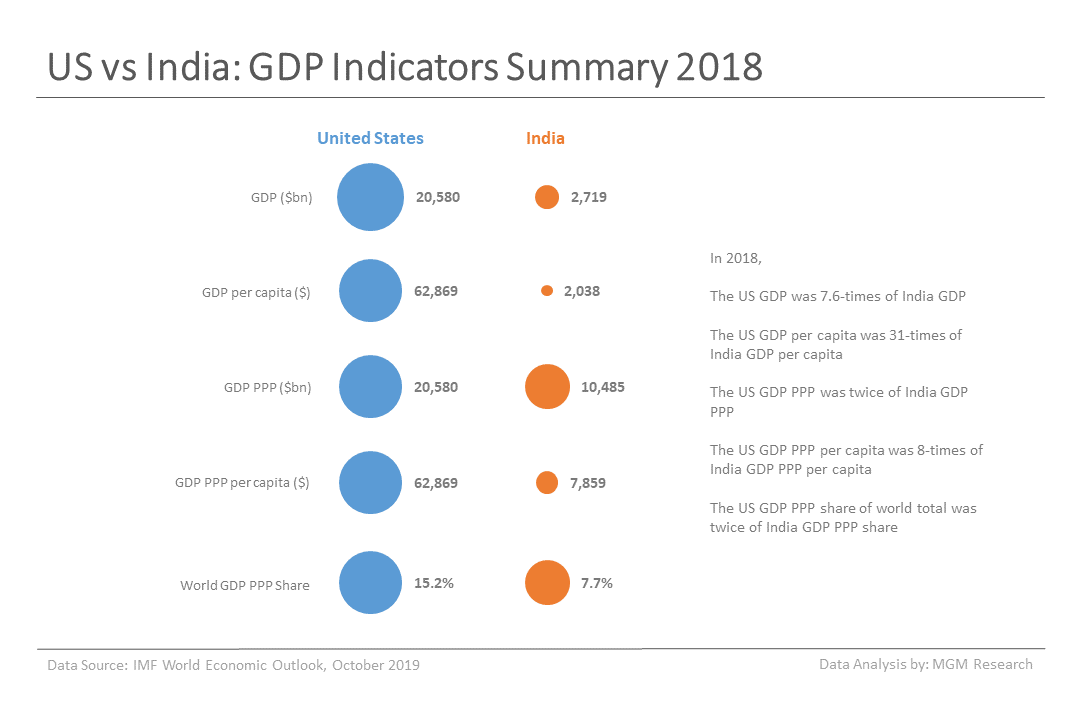
Let us start by comparing the economy size and per capita output of the US and India.
- The US GDP reached $20,580 billion and India GDP reached $2,719 billion during 2018. So, the US GDP was 7.6-times of India GDP in 2018.
- The US GDP per capita was $62,869 and India GDP per capita was $2,038 in 2018. So, the US GDP per capita was 31-times India GDP per capita in 2018.
- The US GDP PPP reached $20,580 billion and India GDP PPP reached $10,485 billion during 2018. So, the US GDP PPP was twice of India GDP PPP in 2018.
- The US GDP PPP per capita was $62,869 and India GDP PPP per capita was $7,859 in 2018. So, the US GDP PPP per capita was 8-times India GDP PPP per capita in 2018.
- The US GDP PPP share of the world total GDP PPP was 15.2% and India GDP PPP share of the world total GDP PPP was 7.7% in 2018.
The chart below provides a summary of the US and India GDP indicators during 2018.
United States vs India - GDP Comparison
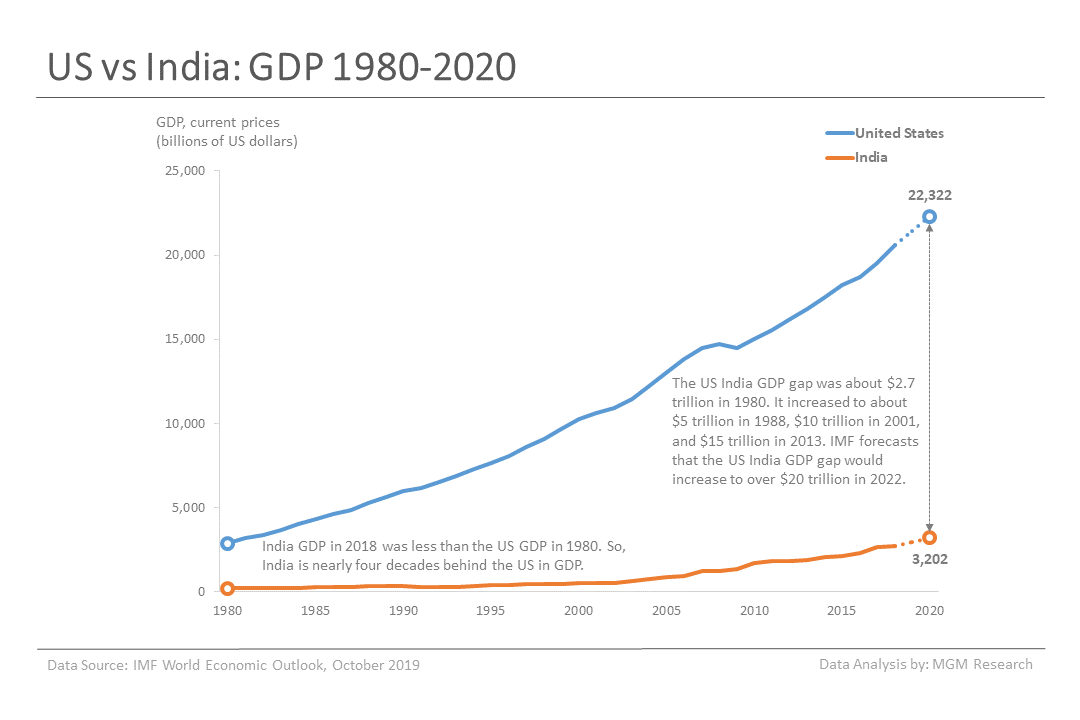
The US is a much bigger economy than India. During 1980, the US GDP was $2,857 billion, and India GDP was $189 billion. India GDP in 2018 was less than the US GDP in 1980. So, India is nearly four decades behind the US in GDP.
The gap between the US and India GDP has been consistently increasing over the last four decades. The US India GDP gap was about $2.7 trillion in 1980. It increased to about $5 trillion in 1988, $10 trillion in 2001, and $15 trillion in 2013. IMF forecasts that the US and India GDP gap would increase to over $20 trillion in 2022.
The following chart provides a comparison of the US and India GDP from 1980 to 2020.
United States vs India - Population Comparison
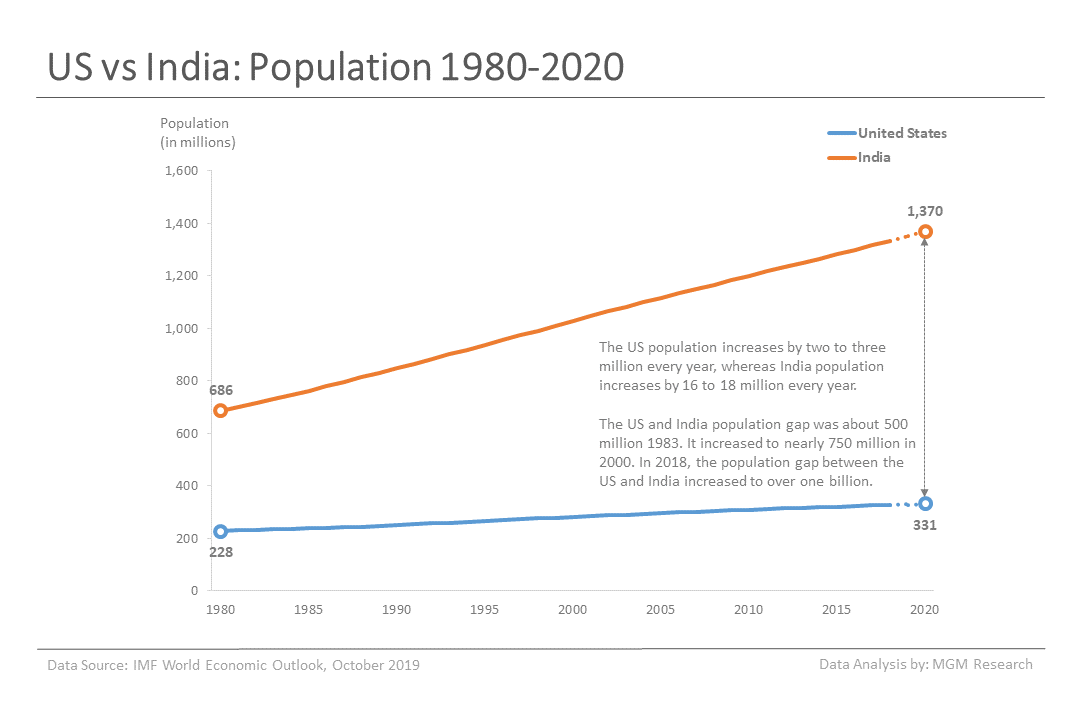
Before comparing GDP per capita growth, let us first compare the population growth of the US and India. During 1980, the US population was 228 million and India population was 686 million. So, India population was three-times that of the US population.
The US population increases by two to three million every year, whereas India population increases by 16 to 18 million every year.
As a result, the population gap between the US and India has been increasing. The US and India population gap was about 500 million 1983. It increased to nearly 750 million in 2000. In 2018, the population gap between the US and India increased to over one billion. In 2018, The US population was 327 million and India population was 1,334 million. So, India population was 4.1-times of the US population.
The following chart provides a comparison of the US and India population from 1980 to 2020.
United States vs India - GDP Per Capita Comparison
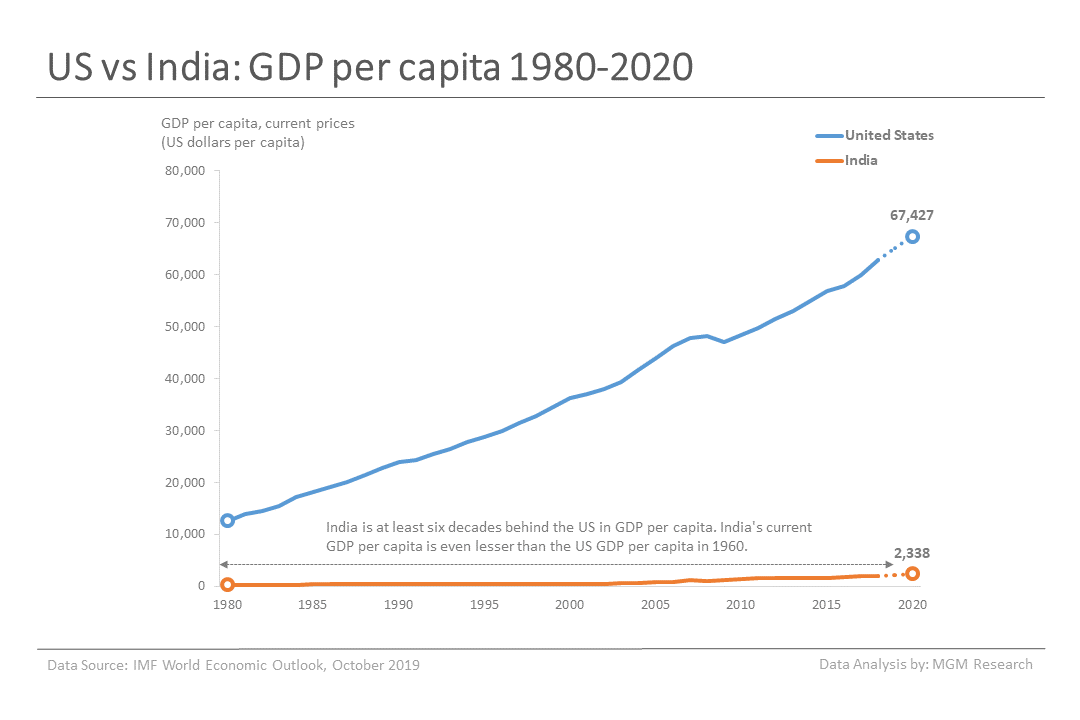
India is at least six decades behind the US in GDP per capita. India’s current GDP per capita is even lesser than the US GDP per capita in 1960. We have observed this by looking at the World Bank World Development Indicators (WDI) data, which is provided from 1960. The IMF data starts from 1980.
During 1980, the US GDP per capita was $12,553 and India GDP per capita was $276. So, the US GDP per capita was 45-times that of India. In 1993, the US GDP per capita was 84-times India GDP per capita. Today, the US GDP per capita is about 30-times of India GDP per capita. In 2020, IMF forecasts that the US GDP per capita would reach $65,112 and India GDP per capita would reach $2,172.
The following chart provides a comparison of the US and India GDP per capita from 1980 to 2020.
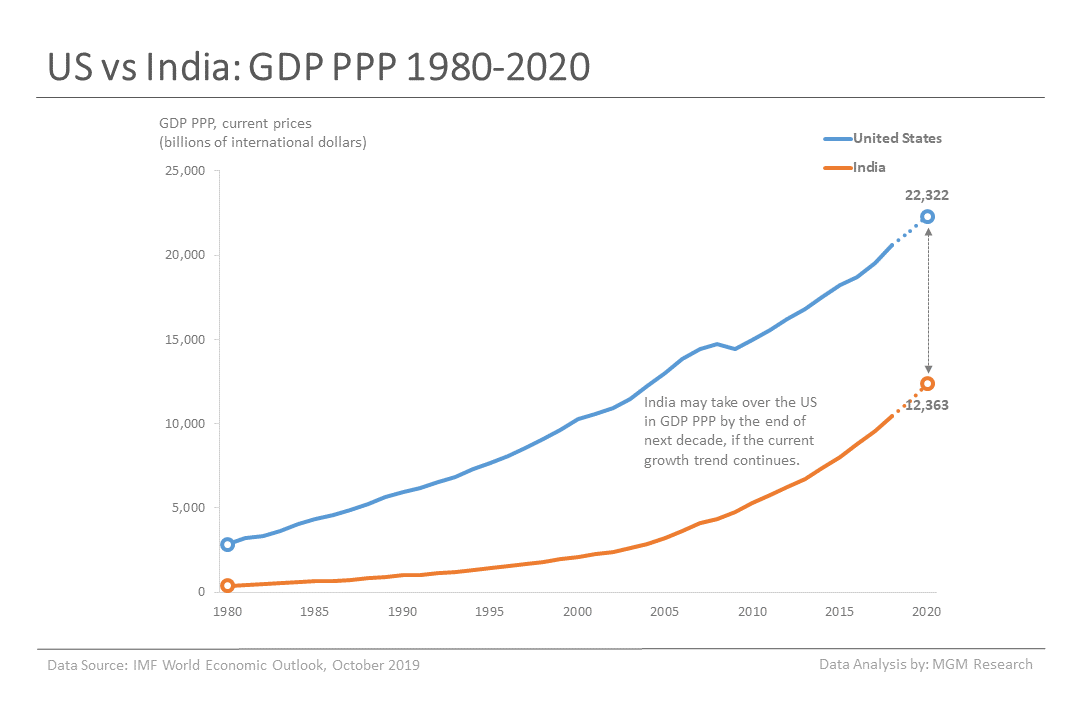
United States vs India - GDP PPP Comparison
During 1980, the US GDP PPP was $2,857 billion, and India GDP PPP was $383 billion. So, the US GDP PPP was 7.5-times that of the India GDP PPP. As a result of faster growth, India GDP PPP gap with the US is narrowing. In 2018, the US GDP PPP was nearly twice of India GDP PPP. India may take over the US in GDP PPP by the end of next decade, if the current growth trend continues. Then, India would be second largest economy in GDP PPP, after China. China took over the US in GDP PPP during 2014.
The following chart provides a comparison of the US and India GDP PPP from 1980 to 2020.
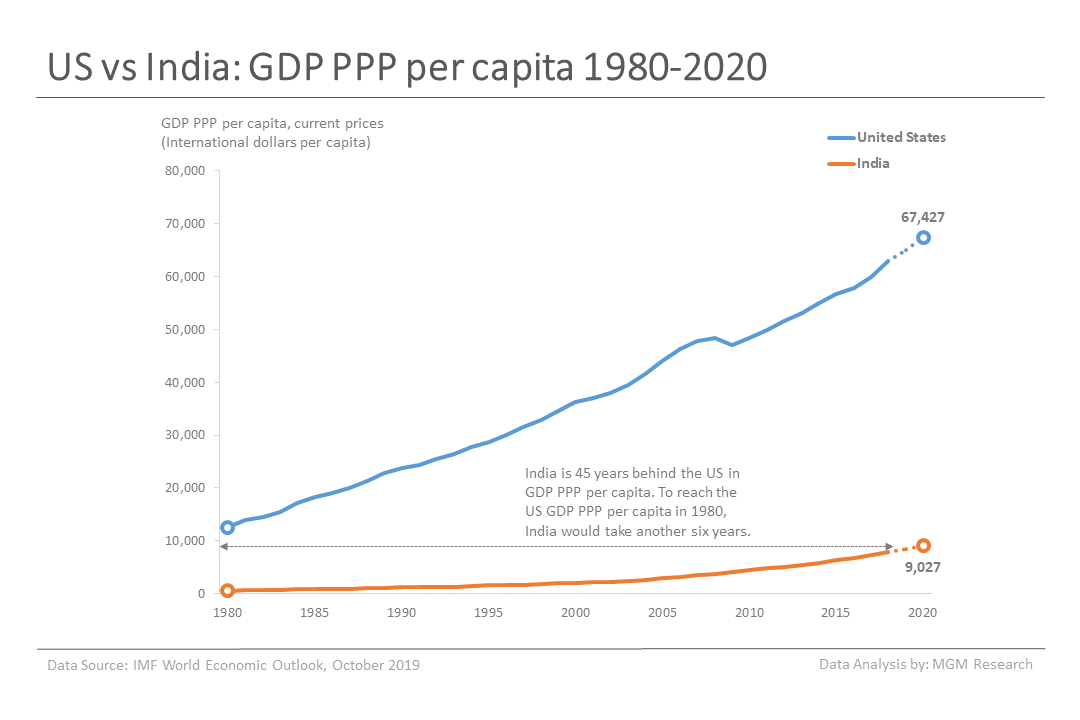
United States vs India - GDP PPP Per Capita Comparison
During 1980, the US GDP PPP per capita was $12,553 and India GDP PPP per capita was $559. To reach the US GDP PPP per capita in 1980, India would take another six years. So, India is 45 years behind the US in GDP PPP per capita.
During 1980, the US GDP PPP per capita was 22-times that of India. In 2018, the US GDP PPP per capita was about 8-times of India GDP PPP per capita. In 2020, IMF forecasts that US GDP PPP per capita would reach $67,427 and India GDP PPP per capita would reach $9,027.
The following chart provides a comparison of the US and India GDP PPP per capita from 1980 to 2020.
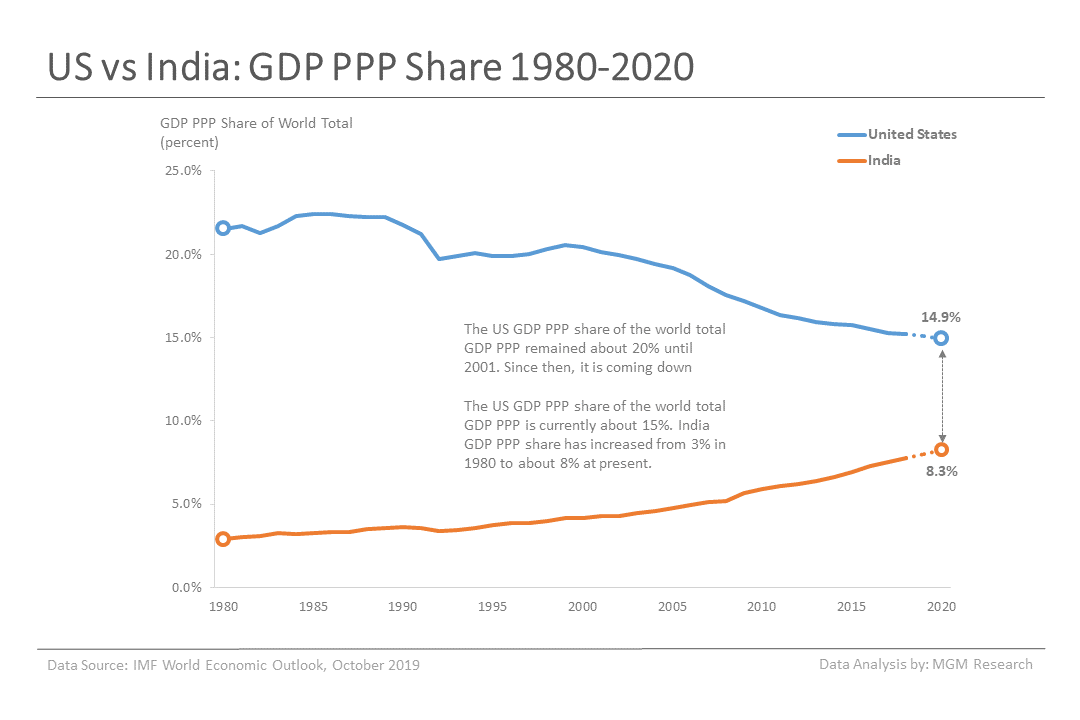
United States vs India - GDP PPP Share Comparison
During 1980, the US GDP PPP share of the world total GDP PPP was 21.5% and India GDP PPP share was 2.9%. The US GDP PPP share of the world total GDP PPP remained about 20% until 2001. Since then, it is coming down as several emerging markets and developing economies are picking up growth. The US GDP PPP share of the world total GDP PPP is currently about 15%. India GDP PPP share has increased from 3% in 1980 to about 8% at present.
The following chart provides a comparison of the US and India GDP PPP share from 1980 to 2020.
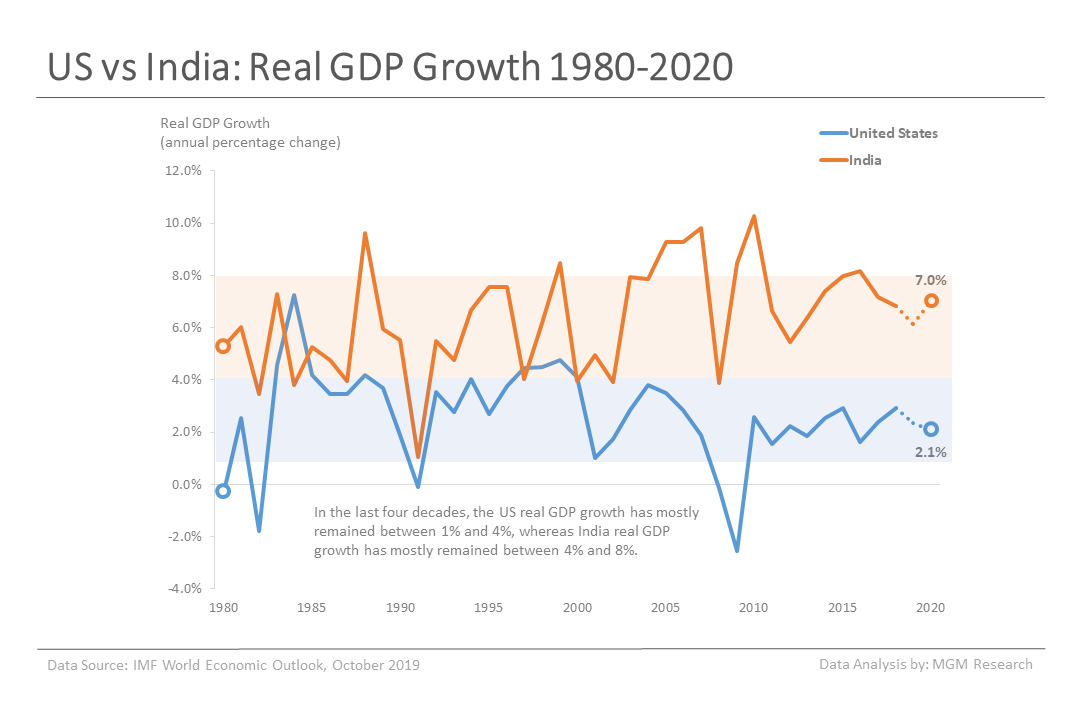
United States vs India - Real GDP Growth Comparison
In the last four decades, the US real GDP growth has mostly remained between 1% and 4%, whereas India real GDP growth has mostly remained between 4% and 8%.
Because of its smaller size, India has mostly remained ahead of the US in real GDP growth. Despite its higher base, the US was ahead of India in real GDP growth three times - during 1984, 1997, and 2000.
IMF estimates that the US real GDP growth would be 2.4% in 2019 and India real GDP growth would be 6.1%. The following chart provides a comparison of the US and India real GDP growth from 1980 to 2020.
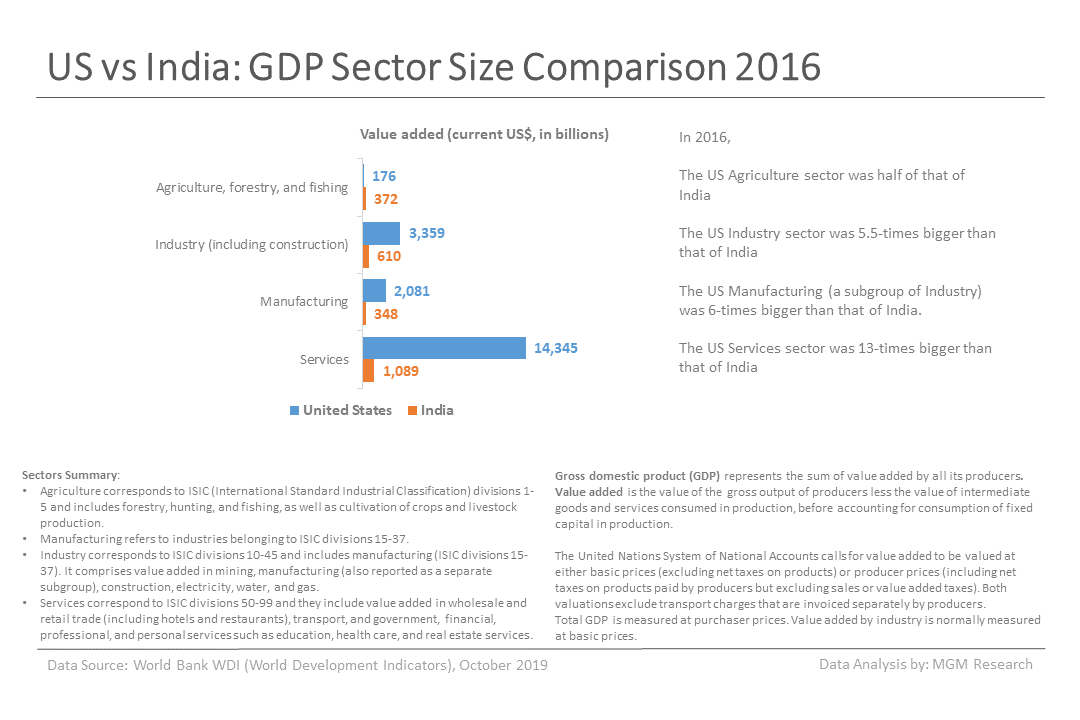
United States vs India - GDP Sector Size Comparison
Let us now compare the size of the following economic sectors in the US and India economies: Agriculture, Industry, Manufacturing, and Services.
The US agriculture sector (includes forestry, hunting, and fishing, as well as cultivation of crops and livestock production) was half of India agriculture sector in 2016.
The US industry sector (comprising of mining, manufacturing, construction, electricity, water, and gas) was 5.5-times bigger than India industry sector in 2016.
The US manufacturing (a subgroup of the industry sector) was six-times bigger than India manufacturing sector during 2016.
The US services sector (comprising of wholesale and retail trade, hotels and restaurants, transport, and government, financial, professional, and personal services such as education, health care, and real estate services) was 13-times bigger than India services sector during 2016.
The following chart provides a size comparison of the US and India key sectors.
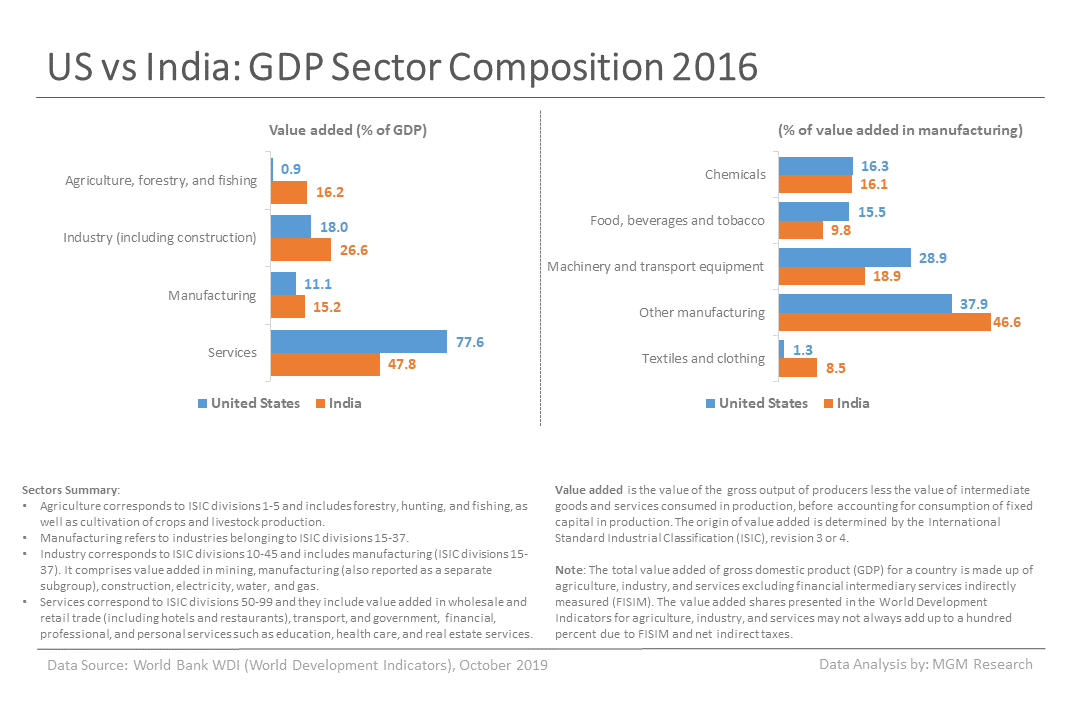
United States vs India - GDP Sector Composition
Now, we will look at how much each of the key economic sectors represent as a percentage of GDP of the US and India.
- Agriculture sector was 0.9% of the US GDP and 16.2% of India GDP in 2016.
- Industry sector was 18.0% of the US GDP and 26.6% of India GDP in 2016.
- Manufacturing subgroup was 11.1% of the US GDP and 15.2% of India GDP in 2016.
- Services sector was 77.6% of the US GDP and 47.8% of India GDP in 2016.
The composition of different industries in the manufacturing subgroup of the US and India is as follows:
- Chemicals was 16.3% of the US manufacturing and 16.1% of India manufacturing in 2016.
- Food, beverages, and tobacco was 15.5% of the US manufacturing and 9.8% of India manufacturing in 2016.
- Machinery and transport equipment were 28.9% of the US manufacturing and 18.9% of India manufacturing in 2016.
- Textiles and Clothing was 1.3% of the US manufacturing and 8.5% of India manufacturing in 2016.
- Other manufacturing was 37.9% of the US manufacturing and 46.6% of India manufacturing in 2016.
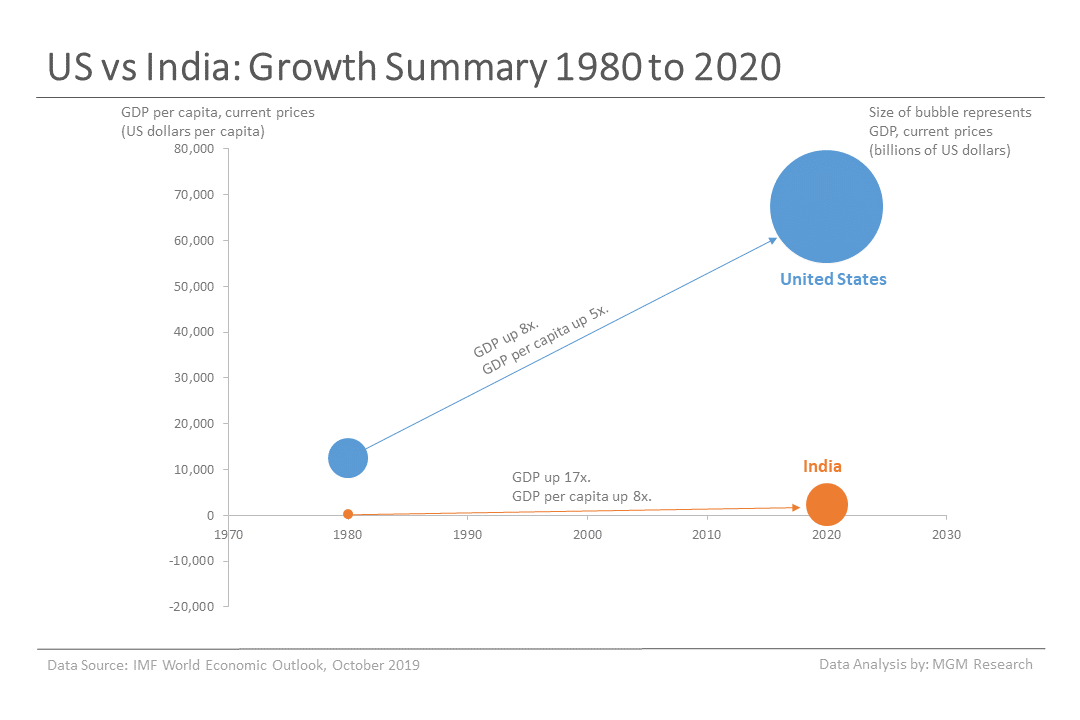
United States vs India - GDP Indicators Growth Summary
The following chart shows the increase in GDP and GDP per capita of the US and India from 1980 to 2020. The US GDP in 2020 would be eight-times its GDP in 1980 and India GDP in 2020 would be 17-times its GDP in 1980. The US GDP per capita in 2020 would be five-times its GDP per capita in 1980 and India GDP per capita in 2020 would be eight-times its GDP per capita in 1980.
Related Articles
United States GDP by Presidents 1980-2020
India GDP by Prime Ministers 1980-2020
Is India GDP target of $5 trillion by 2024 achievable?