In this article, we will compare the United Kingdom (UK) and India on several GDP (Gross Domestic Product) indicators such as nominal GDP, GDP per capita, GDP PPP (Purchasing Power Parity), GDP PPP per capita, GDP PPP share of the world total GDP PPP, real GDP growth, and GDP sector composition. We will provide 10 charts comparing the UK and India GDP indicators data for the 40-year period from 1980 to 2020. We will compare the UK and India using the GDP indicators data from IMF (International Monetary Fund).
UK vs India - GDP Indicators Summary
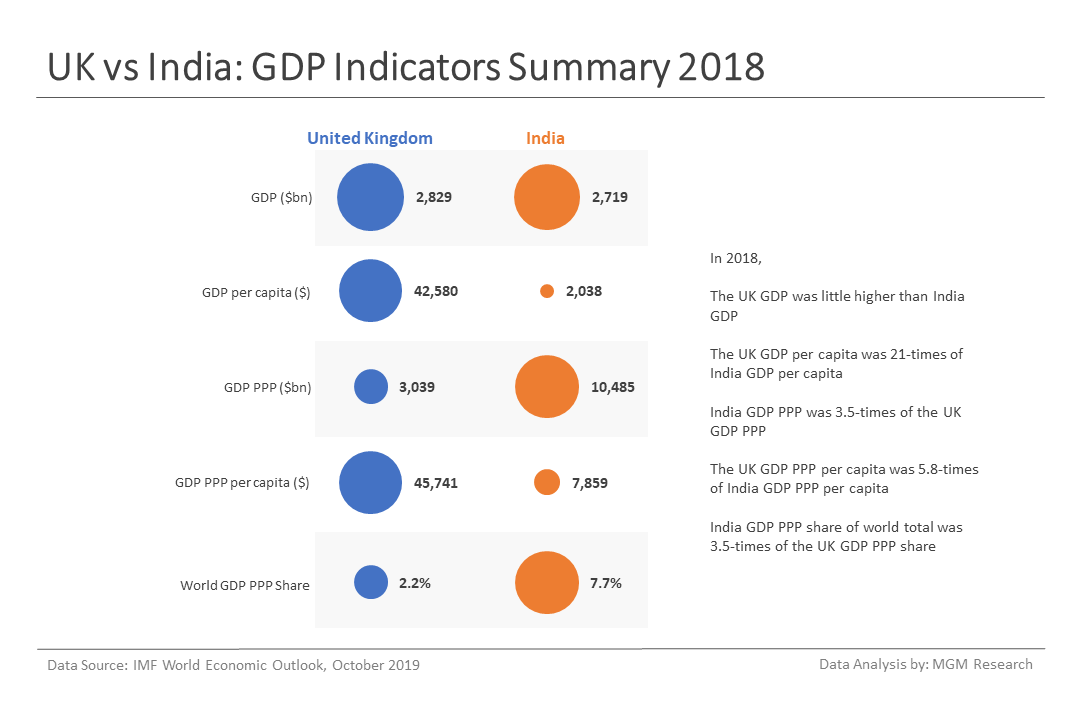
Let us start by comparing the economy size and per capita output of the UK and India.
- The UK GDP reached $2,829 billion and India GDP reached $2,719 billion during 2018. So, the UK GDP was little higher than India GDP in 2018.
- The UK GDP per capita was $42,580 and India GDP per capita was $2,038 in 2018. So, the UK GDP per capita was 21-times India GDP per capita in 2018.
- The UK GDP PPP reached $3,039 billion and India GDP PPP reached $10,485 billion during 2018. So, India GDP PPP was 3.5-times of the UK GDP PPP in 2018.
- The UK GDP PPP per capita was $45,741 and India GDP PPP per capita was $7,859 in 2018. So, the UK GDP PPP per capita was 5.8-times India GDP PPP per capita in 2018.
- The UK GDP PPP share of the world total GDP PPP was 2.2% and India GDP PPP share of the world total GDP PPP was 7.7% in 2018.
The chart below provides a summary of the UK and India GDP indicators during 2018.
UK vs India - GDP Comparison
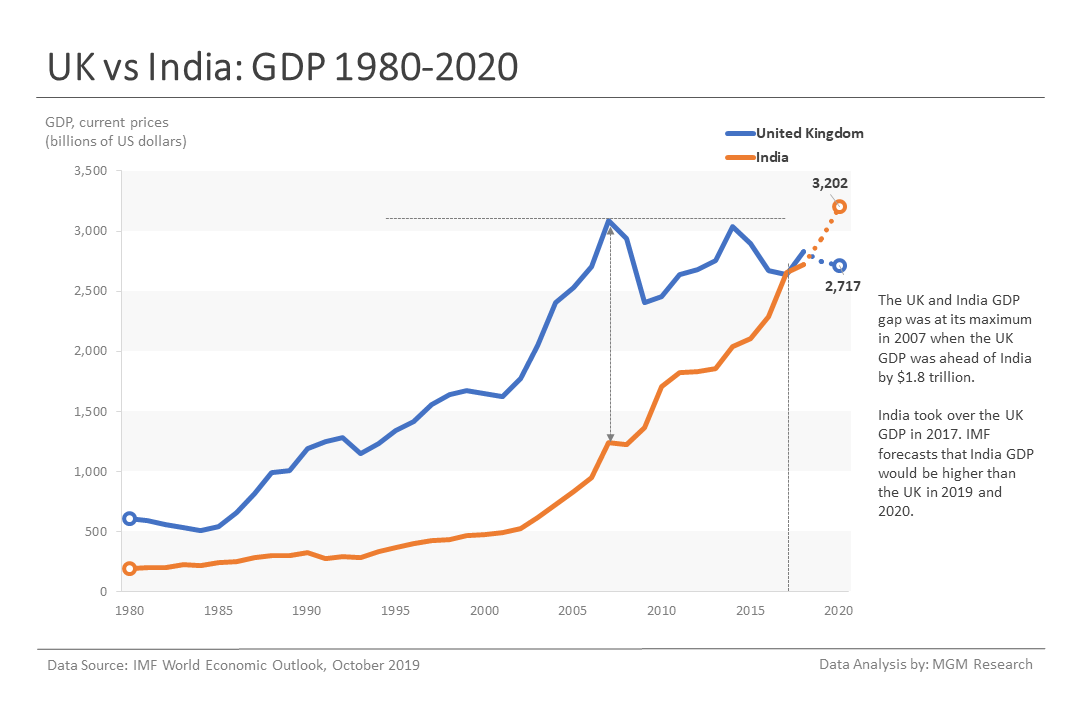
During 1980, the UK GDP was $605 billion, and India GDP was $189 billion. So, the UK GDP was 3.2-times of India GDP. The UK and India GDP gap were at its maximum in 2007, when the UK GDP was ahead of India by $1.8 trillion. India kept reducing the GDP gap after that. India took over the UK GDP in 2017.
IMF forecasts that India GDP would be higher than the UK in 2019 and 2020. IMF estimates the UK GDP to reach $2,744 billion and India GDP to reach $2,936 billion in 2019. In 2020, IMF forecasts that the UK GDP would reach $2,717 billion and India GDP would reach $3,202 billion.
The following chart provides a comparison of the UK and India GDP from 1980 to 2020.
UK vs India - Population Comparison
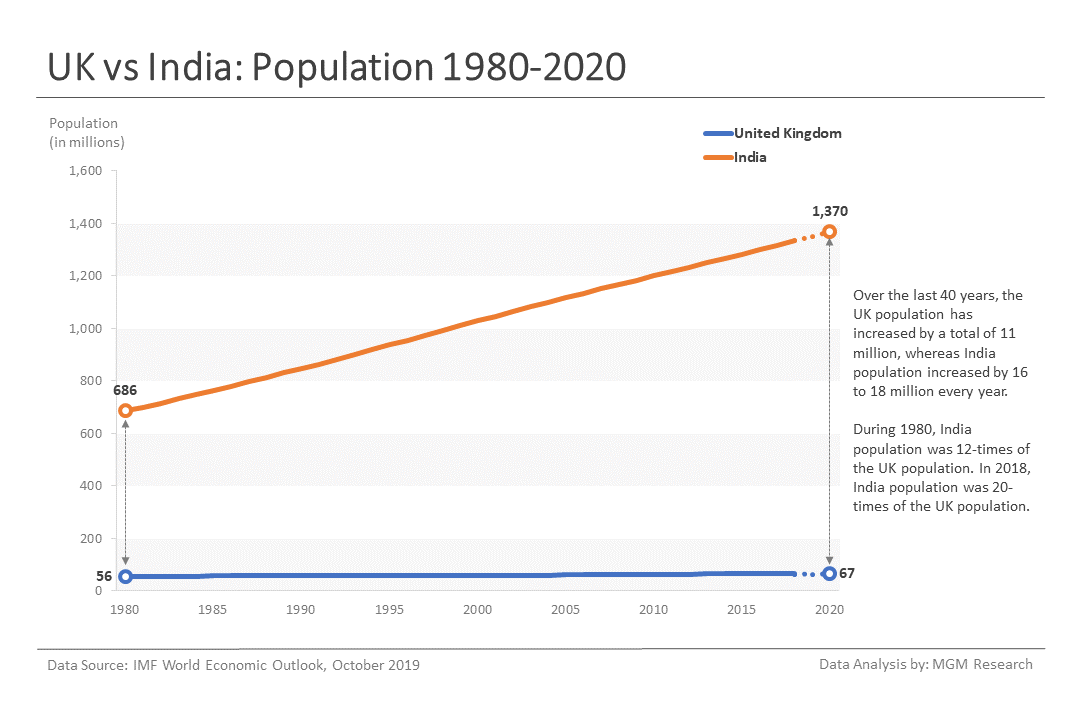
Before comparing GDP per capita growth, let us first compare the population growth of the UK and India. During 1980, the UK population was 56 million and India population was 686 million. So, India population was 12-times of the UK population.
Over the last 40 years, the UK population has increased by a total of 11 million, whereas India population increased by 16 to 18 million every year. In 2018, The UK population was 66 million and India population was 1,334 million. So, India population was 20-times of the UK population.
The following chart provides a comparison of the UK and India population from 1980 to 2020.
UK vs India - GDP Per Capita Comparison
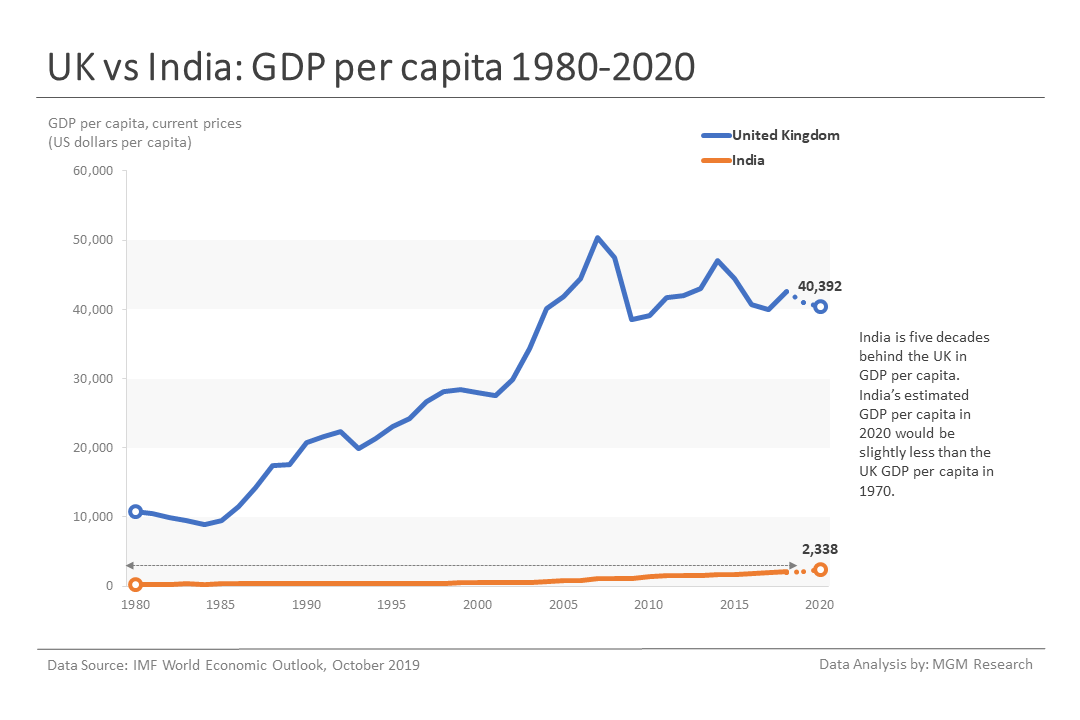
India is five decades behind the UK in GDP per capita. India’s estimated GDP per capita in 2020 would be slightly less than the UK GDP per capita in 1970. We have observed this by looking at the World Bank World Development Indicators (WDI) data for the UK, which is provided from 1960.
During 1980, the UK GDP per capita was $10,735 and India GDP per capita was $276. So, the UK GDP per capita was 39-times that of India. In 1991, the UK GDP per capita was 68-times India GDP per capita. Today, the UK GDP per capita is about 19-times of India GDP per capita. In 2020, IMF forecasts that the UK GDP per capita would reach $40,392 and India GDP per capita would reach $2,338.
The following chart provides a comparison of the UK and India GDP per capita from 1980 to 2020.
UK vs India - GDP PPP Comparison
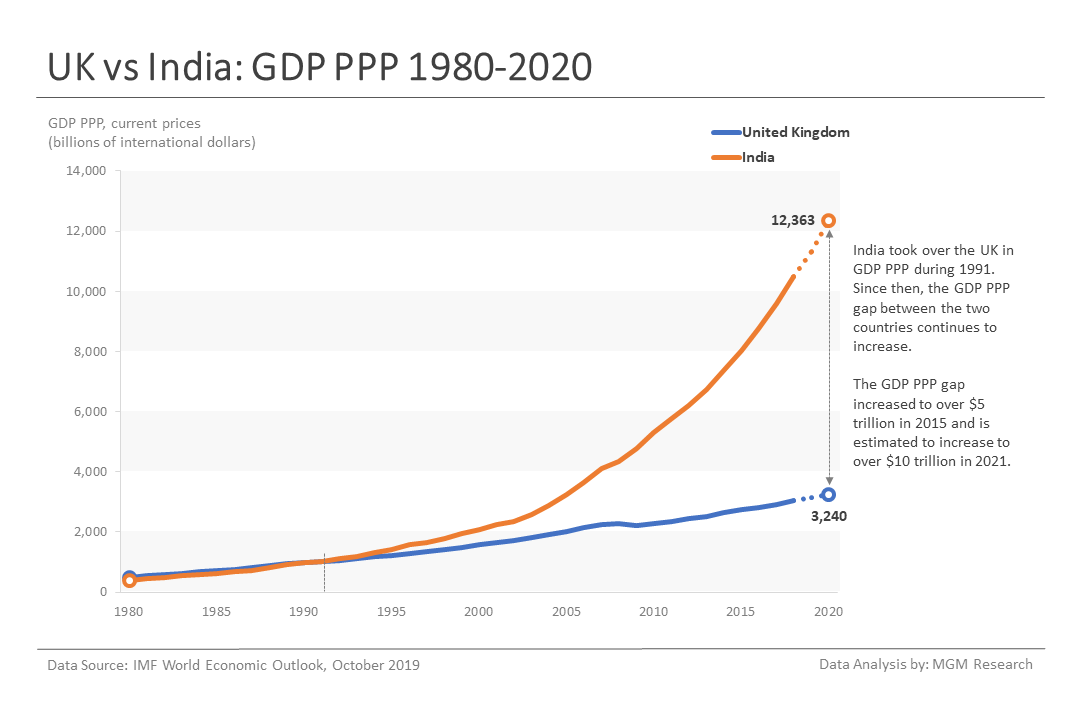
During 1980, the UK GDP PPP was $499 billion, and India GDP PPP was $383 billion. So, the UK GDP PPP was little ahead of India GDP PPP. India took over the UK in GDP PPP during 1991. Since then, the GDP PPP gap between the two countries continues to increase. The GDP PPP gap increased to over $5 trillion in 2015 and is estimated to increase to over $10 trillion in 2021.
The following chart provides a comparison of the UK and India GDP PPP from 1980 to 2020.
UK vs India - GDP PPP Per Capita Comparison
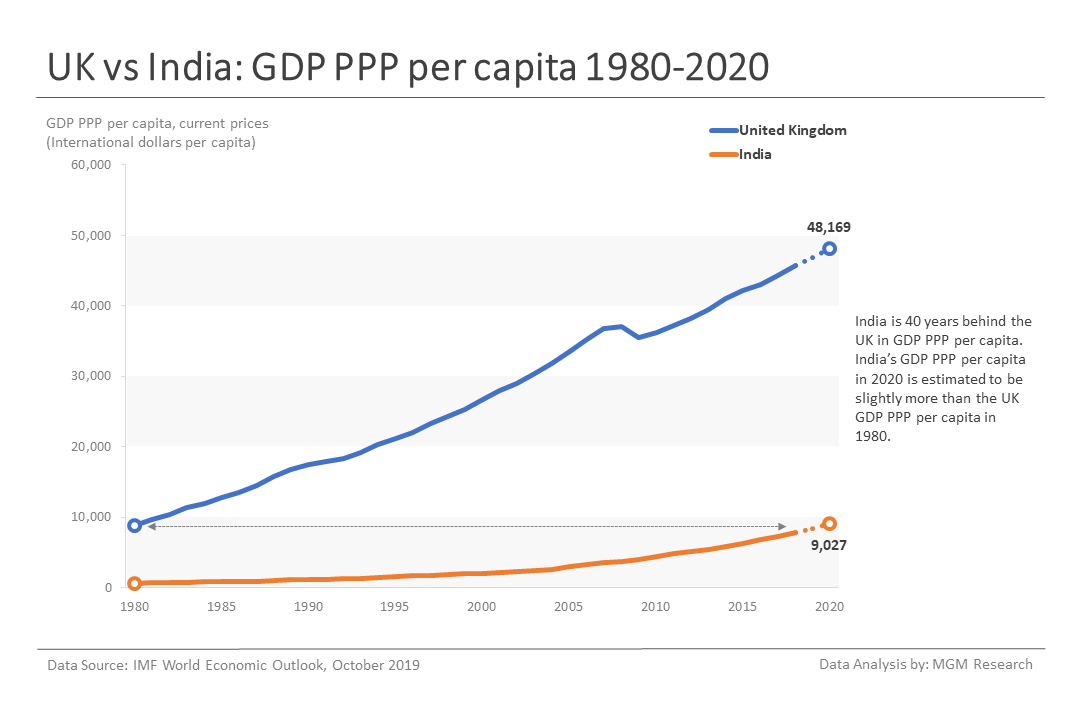
During 1980, the UK GDP PPP per capita was $8,853 and India GDP PPP per capita was $559. India is 40 years behind the UK in GDP PPP per capita. India’s GDP PPP per capita in 2020 is estimated to be slightly more than the UK GDP PPP per capita in 1980.
During 1980, the UK GDP PPP per capita was about 16-times that of India. In 2018, the UK GDP PPP per capita was about 6-times of India GDP PPP per capita. In 2020, IMF forecasts that US GDP PPP per capita would reach $48,169 and India GDP PPP per capita would reach $9,027.
The following chart provides a comparison of the UK and India GDP PPP per capita from 1980 to 2020.
UK vs India - GDP PPP Share Comparison
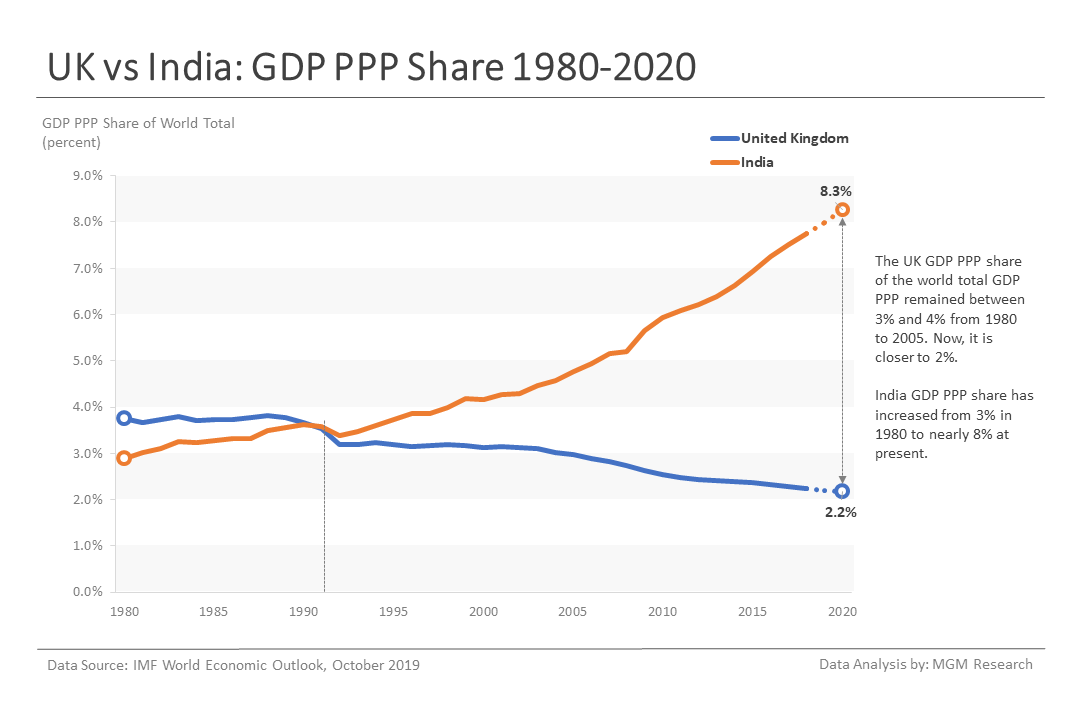
During 1980, the UK GDP PPP share of the world total GDP PPP was 3.8% and India GDP PPP share was 2.9%. The UK GDP PPP share of the world total GDP PPP remained between 3% and 4% from 1980 to 2005. Now, it is closer to 2%. India GDP PPP share has increased from 3% in 1980 to nearly 8% at present.
The following chart provides a comparison of the UK and India GDP PPP share from 1980 to 2020.
UK vs India - Real GDP Growth Comparison
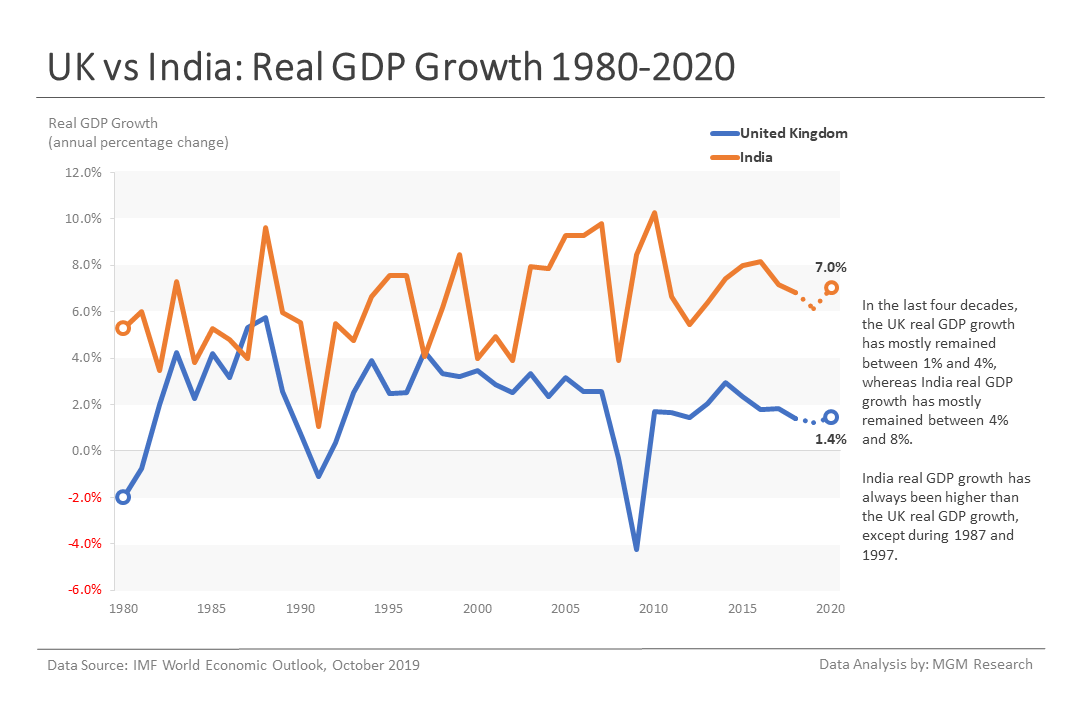
In the last four decades, the UK real GDP growth has mostly remained between 1% and 4%, whereas India real GDP growth has mostly remained between 4% and 8%. India real GDP growth has always been higher than the UK real GDP growth, except during 1987 and 1997
IMF estimates that the UK real GDP growth would be 1.2% in 2019 and India real GDP growth would be 6.1%. The following chart provides a comparison of the UK and India real GDP growth from 1980 to 2020.
UK vs India - GDP Sector Size Comparison
Let us now compare the size of the key economic sectors - Agriculture, Industry, Manufacturing, and Services - in the UK and India economies.
India agriculture sector (includes forestry, hunting, and fishing, as well as cultivation of crops and livestock production) was 26.5 bigger than the UK agriculture sector in 2017.
India industry sector (comprising of mining, manufacturing, construction, electricity, water, and gas) was 1.5-times bigger than the UK industry sector in 2017.
India manufacturing (a subgroup of the industry sector) was 1.7-times bigger than the UK manufacturing sector during 2017.
The UK services sector (comprising of wholesale and retail trade, hotels and restaurants, transport, and government, financial, professional, and personal services such as education, health care, and real estate services) was 1.5-times bigger than India services sector during 2017.
The following chart provides a size comparison of the UK and India key sectors.

UK vs India - GDP Sector Composition
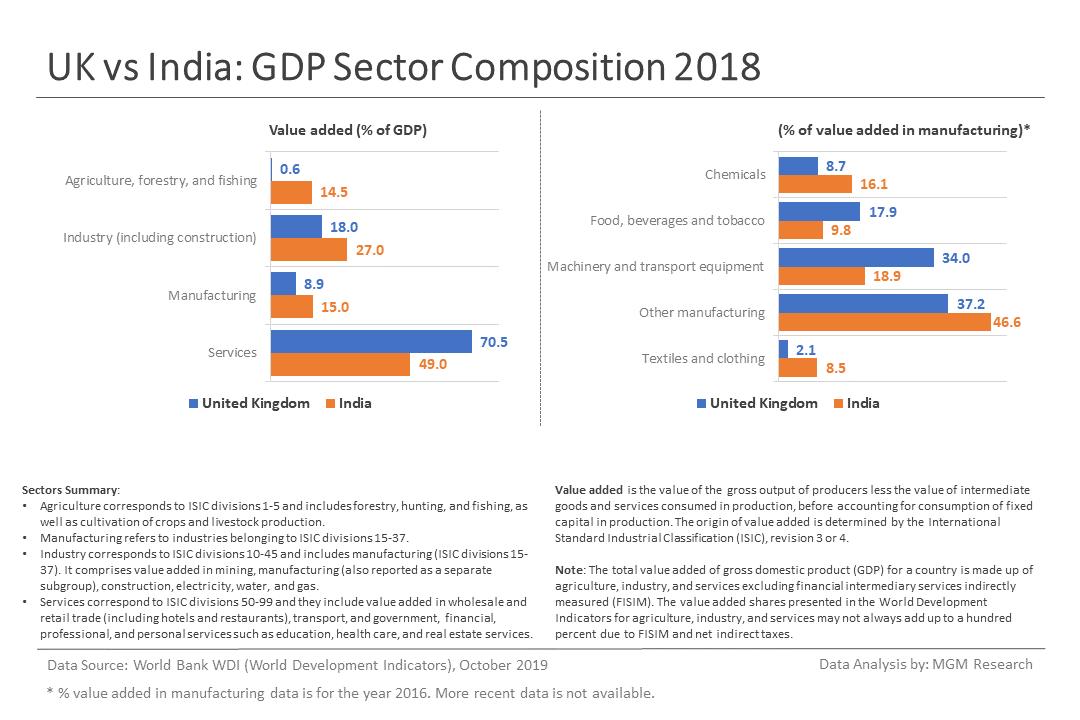
Now, we will look at how much each of the key economic sectors represent as a percentage of GDP of the UK and India.
- Agriculture sector was 0.6% of the UK GDP and 14.5% of India GDP in 2018.
- Industry sector was 18.0% of the UK GDP and 17.0% of India GDP in 2018.
- Manufacturing subgroup was 8.9% of the UK GDP and 15.0% of India GDP in 2018.
- Services sector was 70.5% of the UK GDP and 49.0% of India GDP in 2018.
The composition of different industries in the manufacturing subgroup of the UK and India is as follows:
- Chemicals was 8.7% of the UK manufacturing and 16.1% of India manufacturing in 2016.
- Food, beverages, and tobacco was 17.9% of the UK manufacturing and 9.8% of India manufacturing in 2016.
- Machinery and transport equipment were 34.0% of the UK manufacturing and 18.9% of India manufacturing in 2016.
- Textiles and Clothing was 2.1% of the UK manufacturing and 8.5% of India manufacturing in 2016.
- Other manufacturing was 37.2% of the UK manufacturing and 46.6% of India manufacturing in 2016.
The following chart provides GDP sector composition of the UK and India economies.
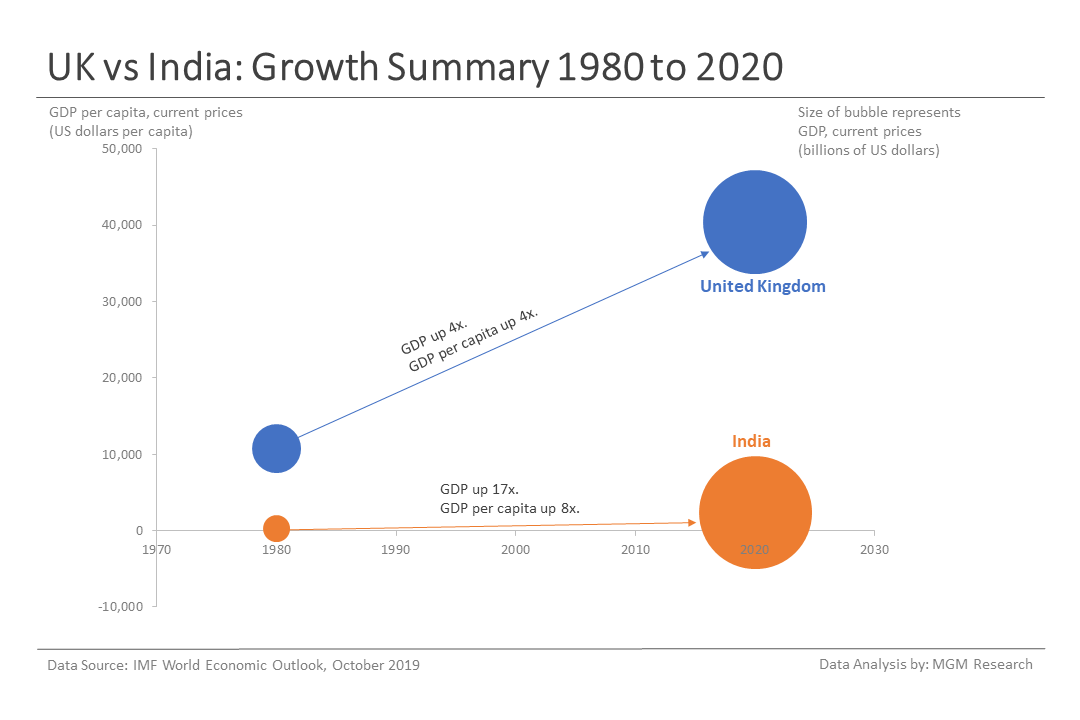
UK vs India - GDP Indicators Growth Summary
The following chart shows the increase in GDP and GDP per capita of the UK and India from 1980 to 2020. The UK GDP in 2020 would be four-times its GDP in 1980 and India GDP in 2020 would be 17-times its GDP in 1980. The UK GDP per capita in 2020 would be four-times its GDP per capita in 1980 and India GDP per capita in 2020 would be eight-times its GDP per capita in 1980.
Related Articles
UK GDP by Prime Ministers 1980-2020
India GDP by Prime Ministers 1980-2020
Is India GDP target of $5 trillion by 2024 achievable?