In this article, we will share eight charts comparing 46 European countries on the following indicators related to the Gross Domestic Product (GDP): Nominal GDP, Total Population, Nominal GDP per capita, GDP on a Purchasing Power Parity (PPP) basis, GDP PPP per capita, Real GDP Growth. We will present the International Monetary Fund (IMF) forecast for these indicators for the year 2019.
List of European Countries Analyzed
As per Wikipedia, the Europe continent has 50 internationally recognized sovereign states (See notes at the bottom). The 50 states are: Albania, Andorra, Armenia, Austria, Azerbaijan, Belarus, Belgium, Bosnia and Herzegovina, Bulgaria, Croatia, Cyprus, Czech Republic, Denmark, Estonia, Finland, France, FYR Macedonia, Georgia, Germany, Greece, Hungary, Iceland, Ireland, Italy, Kazakhstan, Latvia, Liechtenstein, Lithuania, Luxembourg, Malta, Moldova, Monaco, Montenegro, Netherlands, Norway, Poland, Portugal, Romania, Russia, San Marino, Serbia, Slovak Republic, Slovenia, Spain, Sweden, Switzerland, Turkey, Ukraine, United Kingdom, Vatican City
All of these sovereign states are members or observer states of United Nations Eastern Europe regional group or United Nations Western Europe and others regional group, except Cyprus and Kazakhstan (See notes). All except, Belarus, Kazakhstan, and Vatican City are members of Council of Europe (See notes). 28 of these countries are members of the European Union (EU).
There is one de facto state with substantial, but limited recognition: Kosovo.
There are five de facto states with little or no international recognition: Abkhazia, Artsakh, Northern Cyprus, South Ossetia, Transnistria.
IMF provides data for 46 of the 50 countries. IMF does not provide the economic data for Andorra, Liechtenstein, Monaco, and Vatican City. Of the six states that have limited or no international recognition, IMF provides the data for Kosovo only. IMF considers Kosovo in Emerging and Developing Europe group. So, IMF provides the data for 47 European countries.
In our article, we will share the data of 46 European countries. We will provide the analysis for Kazakhstan in our article on Asian continent. Kazakhstan is not a member of Council of Europe. Also, it is in the United Nations Asia Pacific group.
The image below shows the location of the analyzed countries on the Europe map.
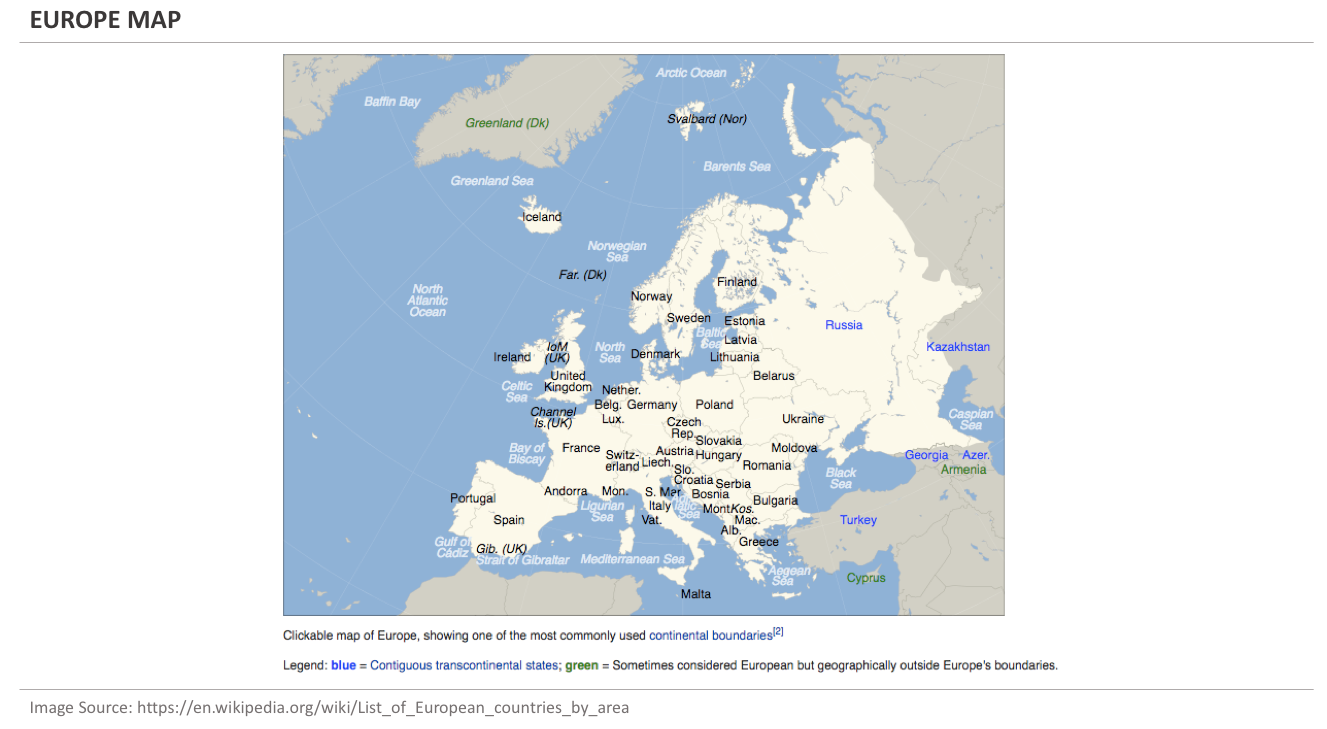
Europe Land Area
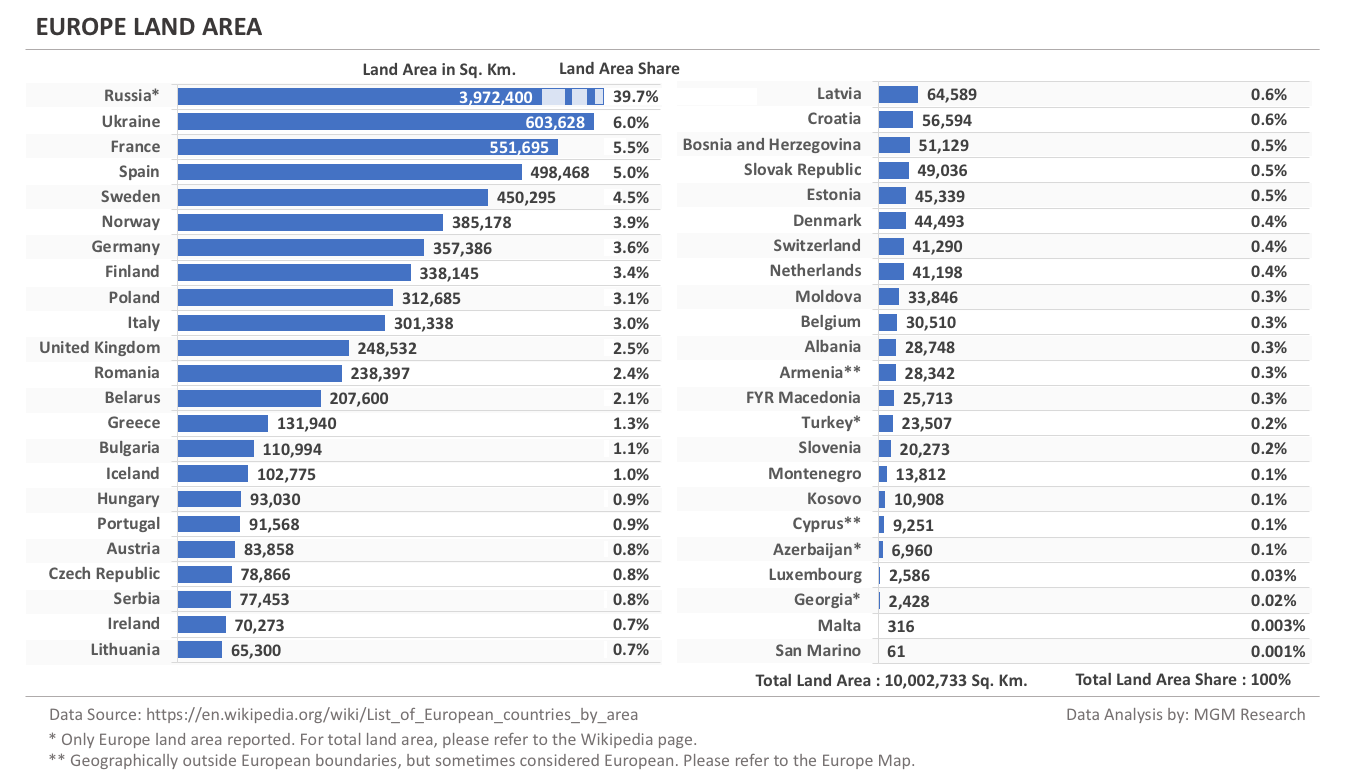
Before we present the data for GDP related indicators, let us take a quick look at the ranking of European countries by their land area. Europe has a total land area of about 10 million square kilometers. Russia share of the total Europe land area is about 40%. The top-five western Europe economies - Germany, France, United Kingdom, Italy, and Spain - have a total land area share of about 20%.
The chart below provides a list of European countries ranked by their land area in the Europe continent.
Europe GDP - 2019 Forecast
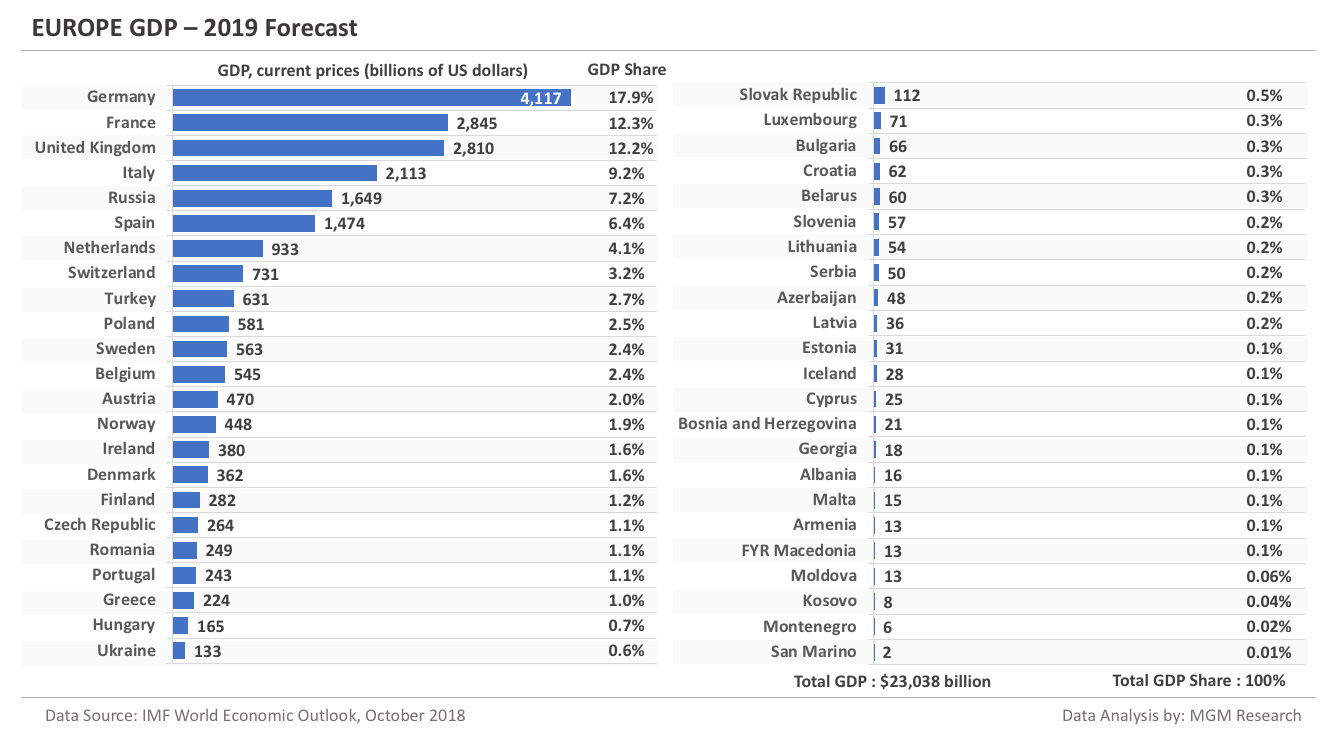
IMF forecasts Europe total GDP to reach $23 trillion in 2019. Germany leads the European countries with a GDP of $4.1 trillion. Germany is followed by France, United Kingdom, and Italy. The top-4 countries combined GDP is 52% of the Europe total GDP. Six countries have GDP more than a trillion dollars. 22 countries have GDP less than $100 billion.
The chart below provides a list of European countries ranked by the GDP in 2019.
Europe Population - 2019 Forecast
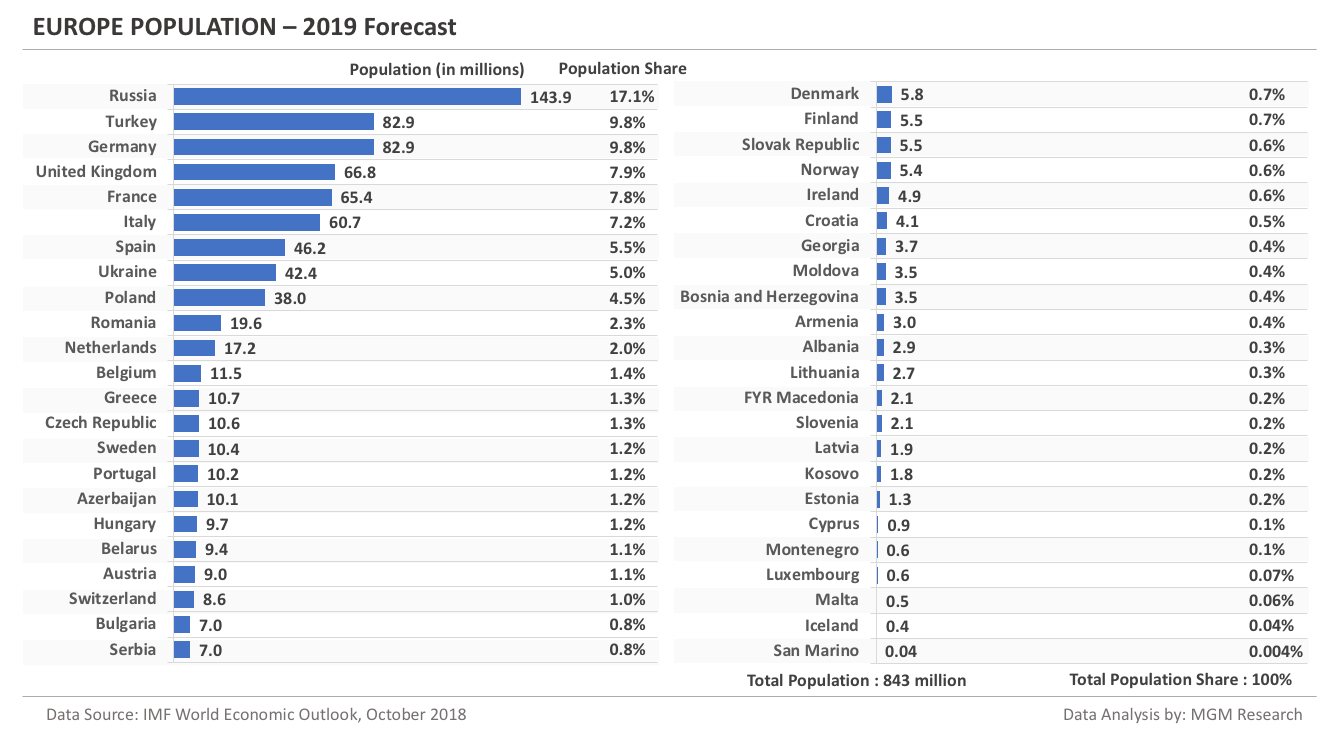
IMF forecasts Europe total population to reach 843 million in 2019. Russia leads the European countries with a population of 144 million. Russia is followed by Turkey, Germany, United Kingdom, and France. The top-5 countries combined population is 52% of the Europe total population. 17 countries have a population more than 10 million. Six countries have a population less than a million.
The chart below provides a list of European countries ranked by the population in 2019.
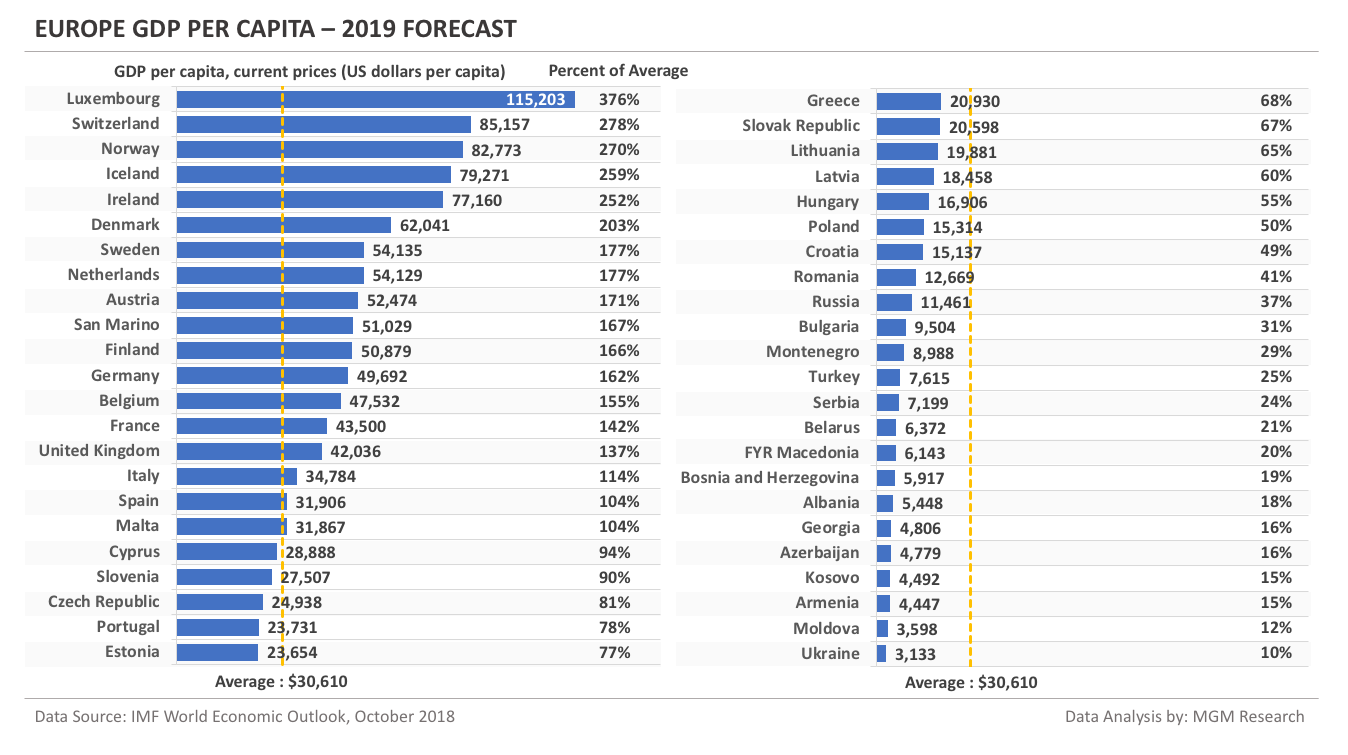
Europe GDP per capita - 2019 Forecast
IMF forecasts Europe average GDP per capita to be $30,610 in 2019. 18 countries have GDP per capita more than the Europe average GDP per capita. All of these countries are in Western Europe. Luxembourg leads the European countries with GDP per capita of $115,203. 28 countries have GDP per capita less than the Europe average GDP per capita. Most of these are Eastern Europe countries. Ukraine ranks last with a GDP per capita of $3,133.
The chart below provides a list of European countries ranked by the GDP per countries in 2019.
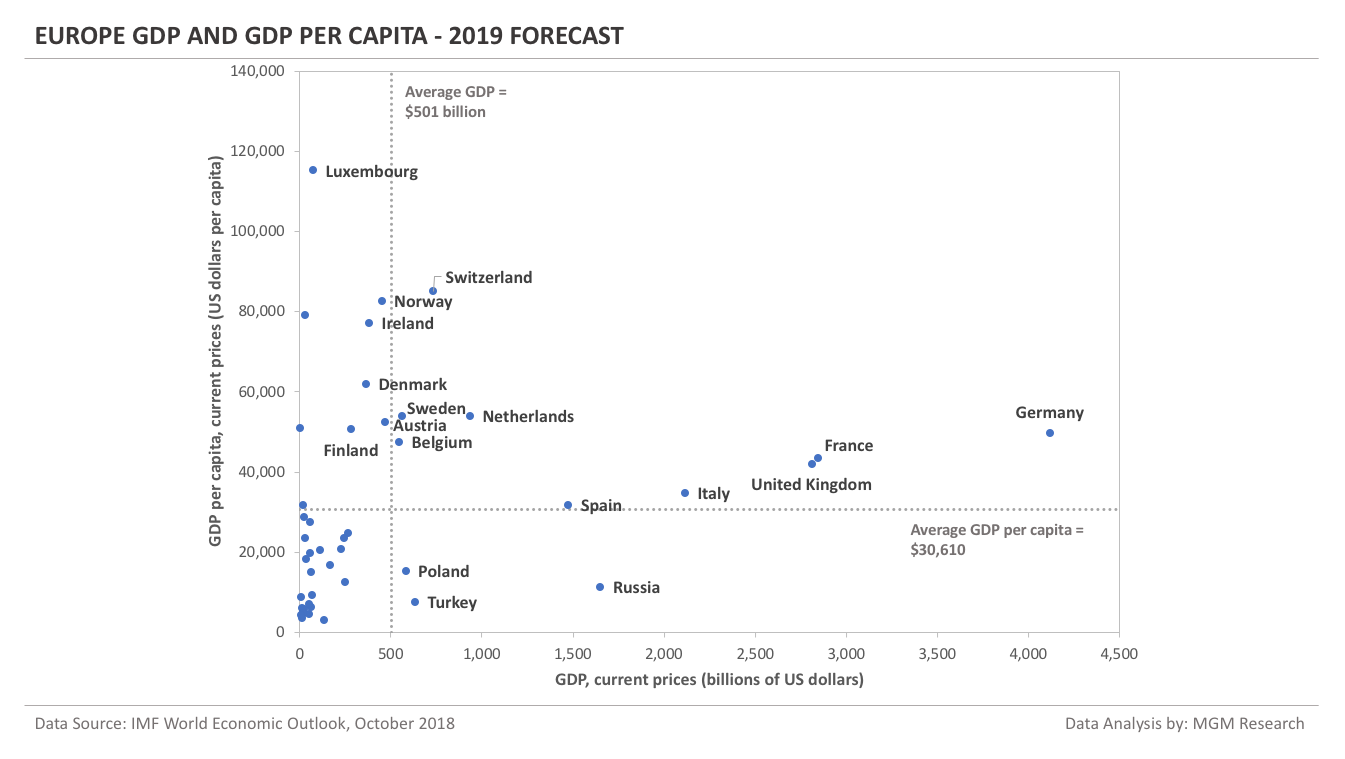
Europe GDP and GDP per capita Matrix
The chart below positions the European countries on a GDP/GDP-PC Matrix chart. The GDP data is on x-axis and the GDP per capita data is on y-axis. Most of the Western Europe countries are placed in the upper segment and all of the Eastern Europe countries are placed in the lower segment.
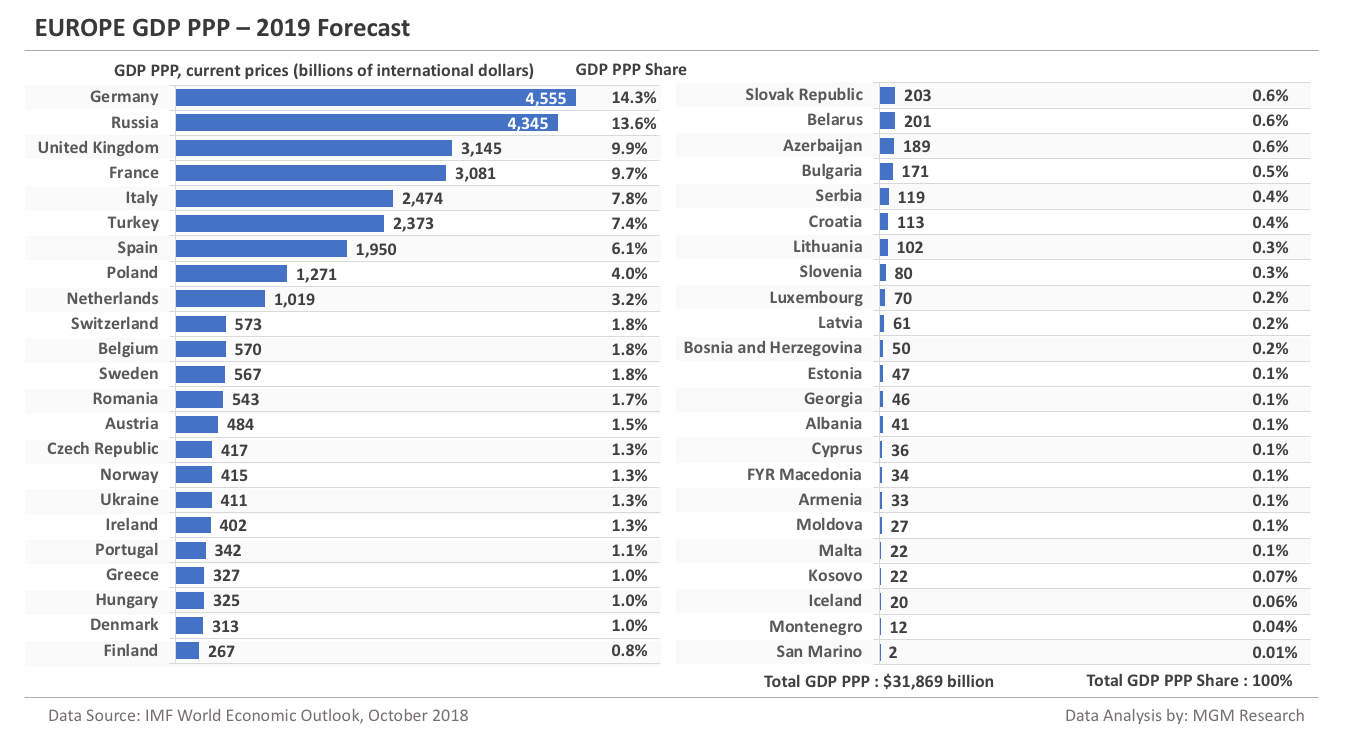
Europe GDP PPP - 2019 Forecast
Now, let us compare European countries GDP on a Purchasing Power Parity (GDP PPP) basis. IMF forecasts Europe total GDP PPP to reach $32 trillion in 2019. Germany leads the European countries with a GDP PPP of $4.6 trillion. On a GDP PPP basis, Russia is ranked second. Russia is followed by United Kingdom, France, and Italy. The top-5 countries combined GDP PPP is 55% of the Europe total GDP PPP. Nine countries have GDP PPP more than a trillion dollars. 16 countries have GDP PPP less than $100 billion.
The chart below provides a list of European countries ranked by the GDP PPP in 2019.
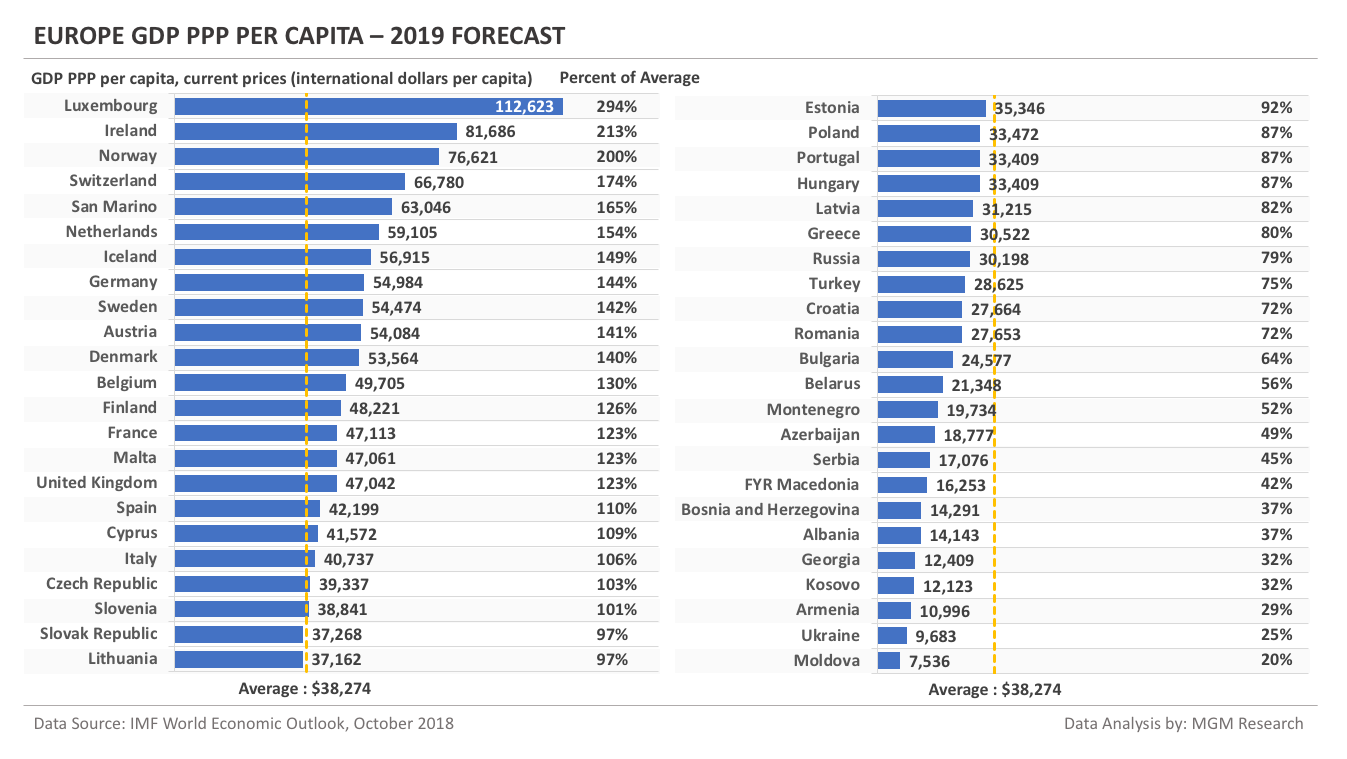
Europe GDP PPP per capita - 2019 Forecast
IMF forecasts Europe average GDP PPP per capita to be $38,274 in 2019. 21 countries have GDP PPP per capita more than the Europe average GDP per capita. Luxembourg leads the European countries with GDP PPP per capita of $112,623. 25 countries have GDP PPP per capita less than the Europe average GDP PPP per capita. Moldova ranks last with a GDP PPP per capita of $7,536.
The chart below provides a list of European countries ranked by the GDP PPP per capita in 2019.
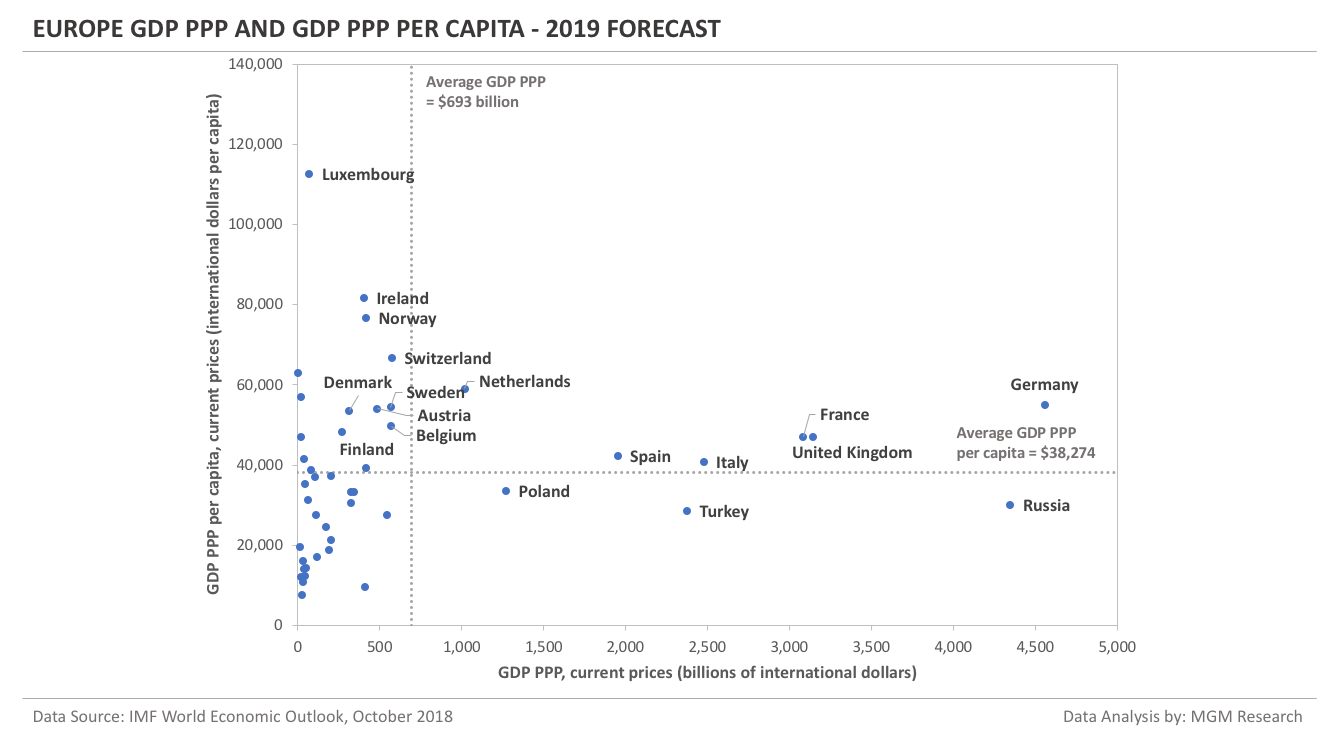
Europe GDP PPP and GDP PPP per capita Matrix
The chart below positions the European countries on a GDP-PPP/GDP-PPP-PC Matrix chart. The GDP PPP data is on x-axis and the GDP PPP per capita data is on y-axis.
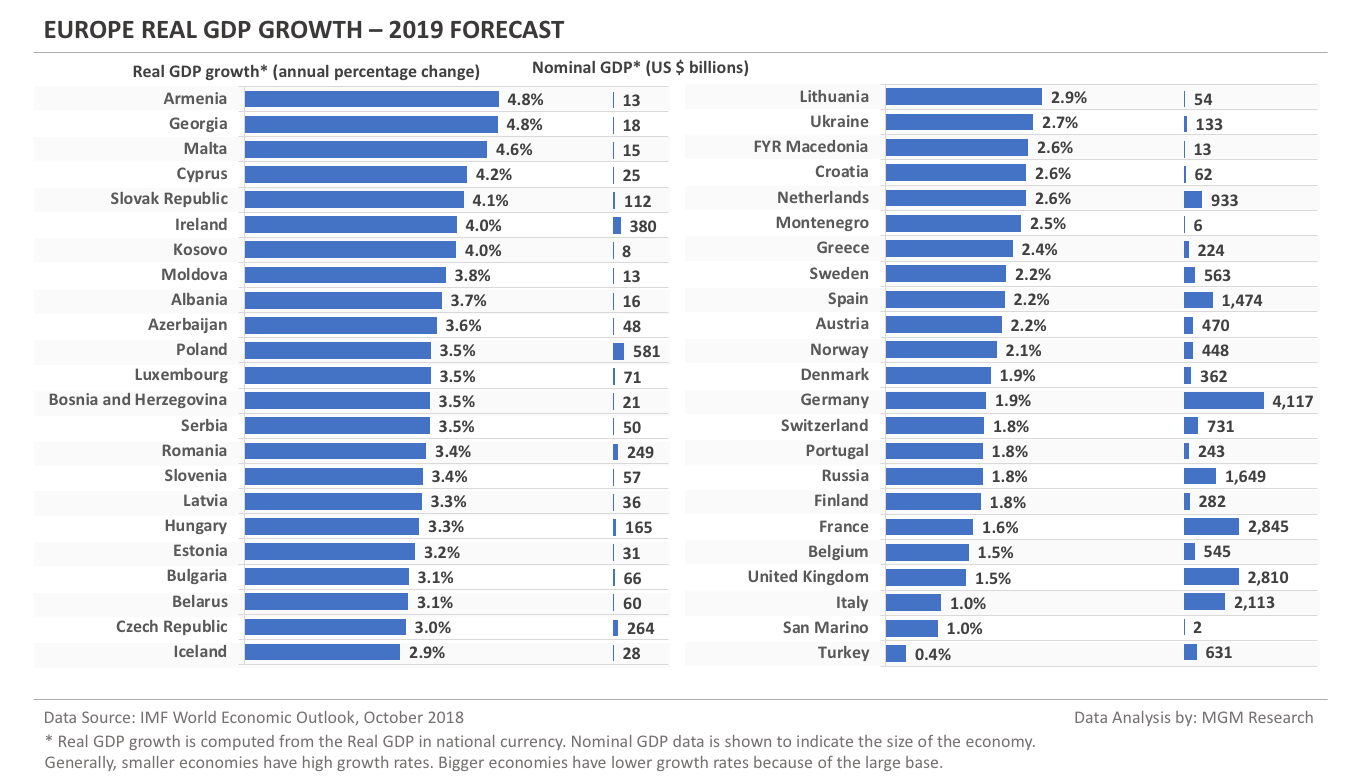
Europe Real GDP Growth - 2019 Forecast
The chart below provides a list of European countries ranked by the real GDP growth in 2019. Real GDP growth is computed from the Real GDP in national currency. Nominal GDP data is also shown in the chart to indicate the size of the economy. Generally, smaller economies have high growth rates. Bigger economies have lower growth rates because of a larger base.
Notes
1. Data Source: International Monetary Fund (IMF) World Economic Outlook (WEO) database, October 2018 edition.
2. Reference Articles:
- Wikipedia page on the list of sovereign states and dependent territories in Europe
- Wikipedia page on the member states of the Council of Europe
- Wikipedia page on the United Nations Regional Groups
- Wikipedia page on the member states of the European Union
- Wikipedia page on the list of European countries by area