China and India are the two most populous countries in the world, with a population of over one billion each. In this article, we will compare China and India on several GDP (Gross Domestic Product) indicators such as nominal GDP, GDP per capita, GDP PPP (Purchasing Power Parity), GDP PPP per capita, GDP PPP share of the world total GDP PPP, real GDP growth, and GDP composition by sectors. We will provide 10 charts comparing China and India GDP indicators data for the 40-year period from 1980 to 2020. We will compare China and India using the GDP indicators data from IMF (International Monetary Fund).
China vs India - GDP Indicators Summary
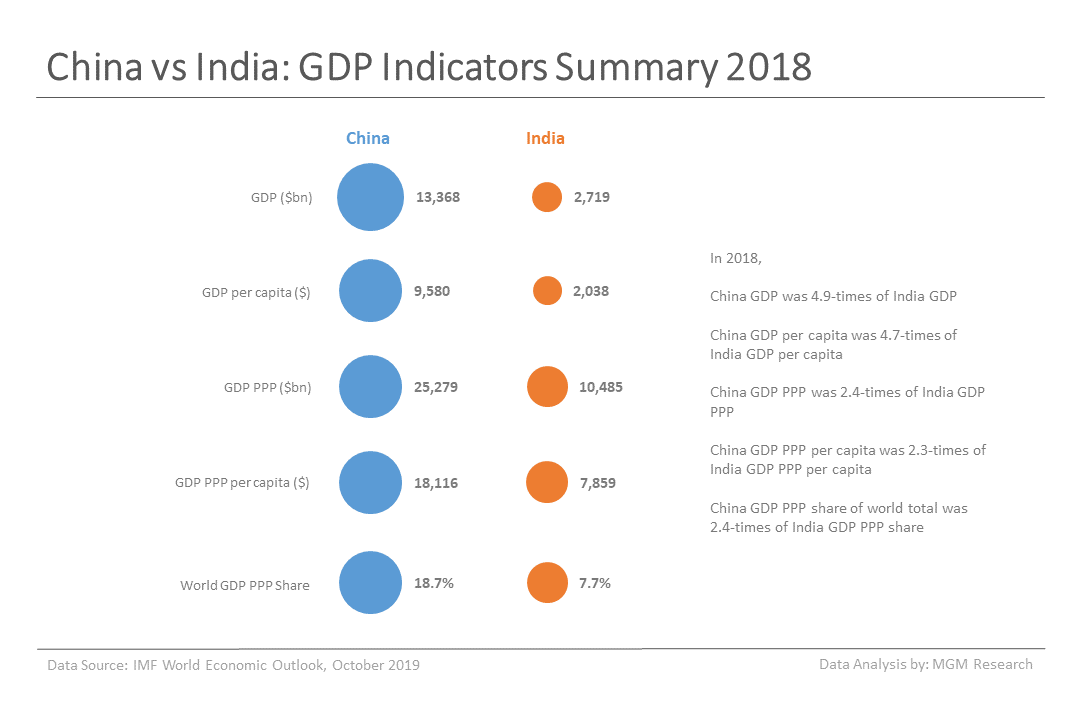
Let us start by comparing the economy size and per capita output of China and India.
- China GDP reached $13,368 billion and India GDP reached $2,719 billion during 2018. So, China GDP was 4.9-times of India GDP in 2018.
- China GDP per capita was $9,580 and India GDP per capita was $2,038 in 2018. So, China GDP per capita was 4.7-times India GDP per capita in 2018.
- China GDP PPP reached $25,279 billion and India GDP PPP reached $10,485 billion during 2018. So, China GDP PPP was 2.4-times of India GDP PPP in 2018.
- China GDP PPP per capita was $18,116 and India GDP PPP per capita was $7,859 in 2018. So, China GDP PPP per capita was 2.3-times India GDP PPP per capita in 2018.
- China GDP PPP share of the world total GDP PPP was 18.7% and India GDP PPP share of the world total GDP PPP was 7.7% in 2018.
The chart below provides a summary of China and India GDP indicators during 2018.
China vs India - GDP Comparison
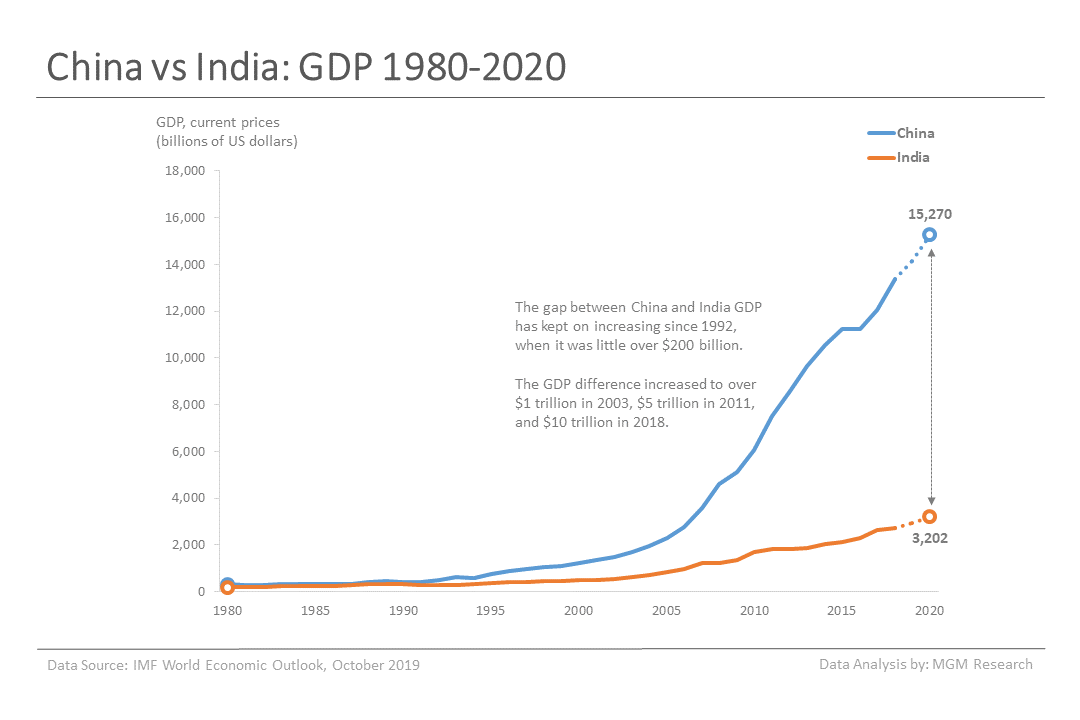
During 1980, China GDP was $305 billion, and India GDP was $189 billion. From 1980 to 1992, the GDP gap between the two countries was always less than $200 billion. The gap between China and India GDP has kept on increasing since then. The GDP difference between the two economies increased to over $1 trillion in 2003, $5 trillion in 2011, and $10 trillion in 2018.
IMF estimates China GDP to reach $14,140 billion and India GDP to reach $2,936 billion in 2019. In 2020, IMF forecasts China GDP would reach $15,270 billion and India GDP would reach $3,202 billion.
The following chart provides a comparison of China and India GDP from 1980 to 2020.
China vs India - Population Comparison
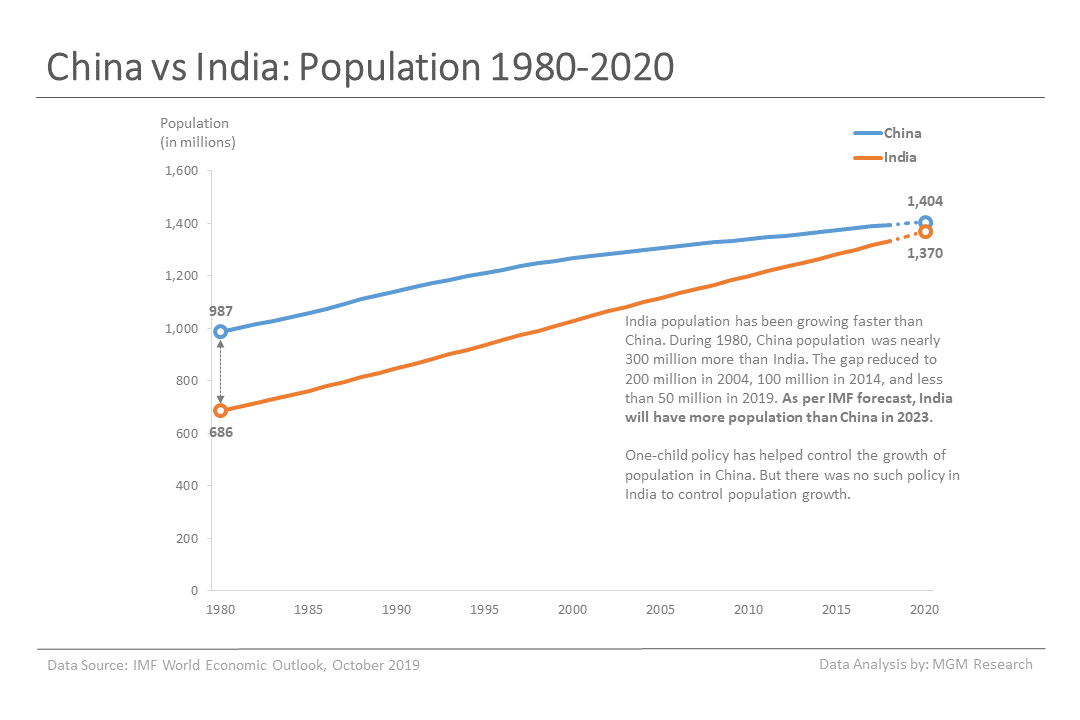
Before comparing GDP per capita growth, let us first compare the population growth of China and India. During 1980, China population was 987 million and India population was 686 million. So, China population was nearly 300 million more than India.
India population has been growing faster than China. The gap reduced to 200 million in 2004, 100 million in 2014, and less than 50 million in 2019. IMF estimates China population to reach 1,400 million and India population to reach 1,352 million in 2019.
As per IMF forecast, India will have more population than China in 2023. In 2023, IMF forecasts China population would reach 1,414 million and India population would reach 1,424 million. One-child policy has helped control the growth of population in China. But there was no such policy in India to control the population growth.
The following chart provides a comparison of China and India population from 1980 to 2020.
China vs India - GDP Per Capita Comparison
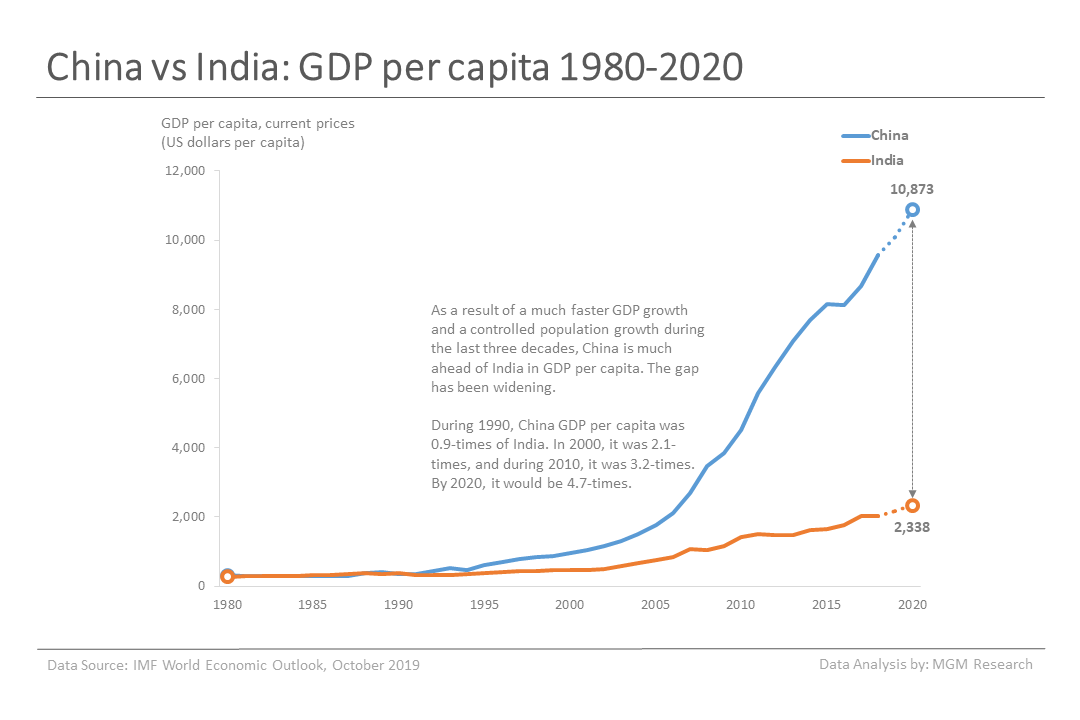
During 1980, China GDP per capita was $309 and India GDP per capita was $276. So, there was not much difference between the two. Up until 1990, there was not much gap between the GDP per capita of the two economies. During 1990, China GDP per capita was 0.9-times of India.
As a result of a much faster GDP growth and a controlled population growth during the last three decades, China is now much ahead of India in the GDP per capita. In 2000, China GDP per capita was 2.1-times of India GDP per capita, and during 2010, it was 3.2-times. By 2020, it would be 4.7-times. The GDP per capita gap between the two economies has been widening.
IMF estimates that China GDP per capita would reach $10,099 and India GDP per capita would reach $2,172 in 2019. In 2020, IMF forecasts that China GDP per capita would reach $10,873 and India GDP per capita would reach $2,338.
The following chart provides a comparison of China and India GDP per capita from 1980 to 2020.
China vs India - GDP PPP Comparison
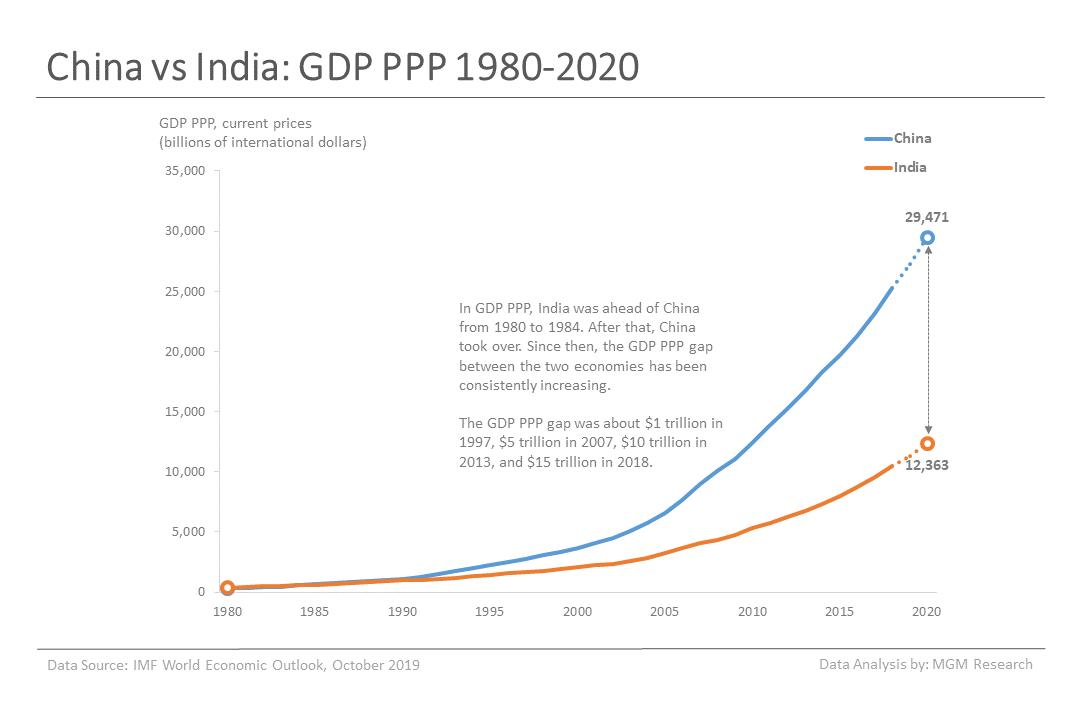
During 1980, China GDP PPP was $306 billion, and India GDP PPP was $383 billion. India was ahead of China in GDP PPP from 1980 to 1984. After that, China took over. Since then, the GDP PPP gap between the two economies has been consistently increasing. The GDP PPP gap was about $1 trillion in 1997, $5 trillion in 2007, $10 trillion in 2013, and $15 trillion in 2018.
IMF estimates China GDP PPP to reach $27,309 billion and India GDP PPP to reach $11,326 billion in 2019. In 2020, IMF forecasts China GDP PPP would reach $29,471 billion and India GDP PPP would reach $12,363 billion.
The following chart provides a comparison of China and India GDP PPP from 1980 to 2020.
China vs India - GDP PPP Per Capita Comparison
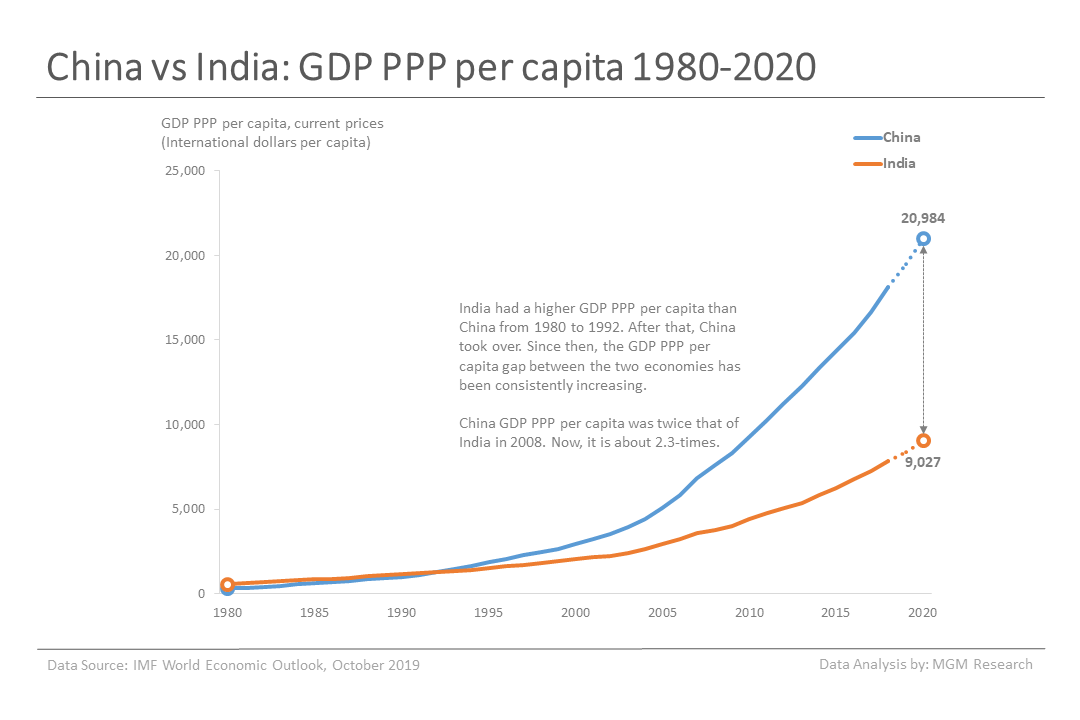
During 1980, China GDP PPP per capita was $310 and India GDP PPP per capita was $559. India had a higher GDP PPP per capita than China from 1980 to 1992. After that, China took over. Since 1992, the GDP PPP per capita gap between the two economies has been consistently increasing. China GDP PPP per capita was twice that of India in 2008.
IMF estimates that China GDP PPP per capita would reach $19,504 and India GDP PPP per capita would reach $8,378 in 2019. In 2020, IMF forecasts that China GDP PPP per capita would reach $20,984 and India GDP PPP per capita would reach $9,027. China GDP PPP per capita would be about 2.3-times of India.
The following chart provides a comparison of China and India GDP PPP per capita from 1980 to 2020.
China vs India - GDP PPP Share Comparison
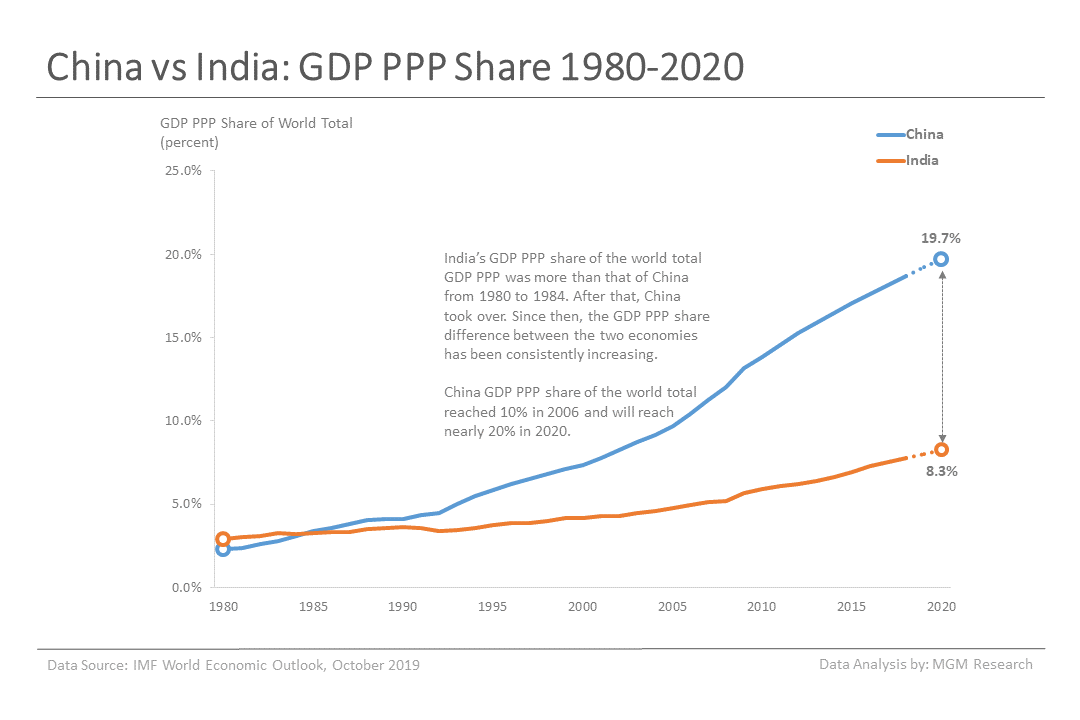
During 1980, China GDP PPP share of the world total GDP PPP was 2.3% and India GDP PPP share was 2.9%. India’s GDP PPP share of the world total GDP PPP was more than that of China from 1980 to 1984. After that, China took over. Since 1984, the GDP PPP share difference between the two economies has been consistently increasing. China GDP PPP share of the world total reached nearly 10% in 2006, double than that of India GDP PPP share of nearly 5%.
IMF estimates China GDP PPP share to reach 19.3% and India GDP PPP share to reach 8.0% in 2019. In 2020, IMF forecasts China GDP PPP share would reach 19.7% and India GDP would PPP share reach 8.3%.
The following chart provides a comparison of China and India GDP PPP share from 1980 to 2020.
China vs India - Real GDP Growth Comparison
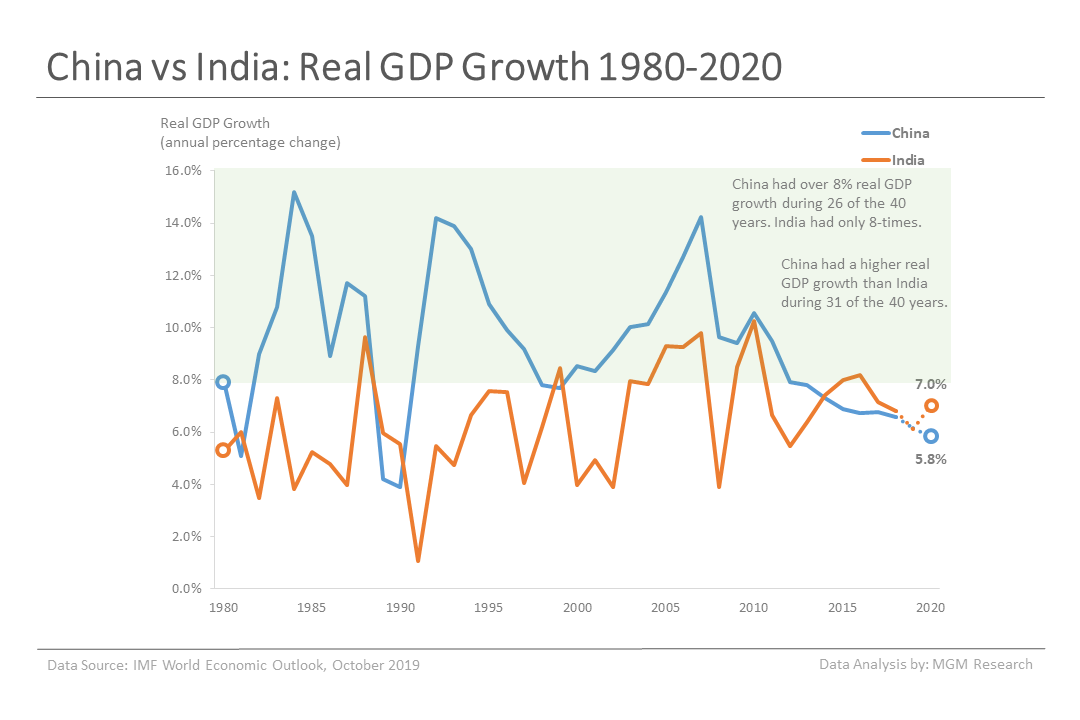
China has grown much faster than India during the last 40 years. China had over 8% real GDP growth during 26 of the 40 years, whereas India had only 8-times. China had a higher real GDP growth than India during 31 of the 40 years.
IMF estimates that China real GDP growth would be 6.1% in 2019 and India real GDP growth would be the same. In 2020, IMF forecasts that China real GDP growth would be 5.8% and India real GDP growth would be 7.0%.
The following chart provides a comparison of China and India real GDP growth from 1980 to 2020.
China vs India - GDP Sector Composition
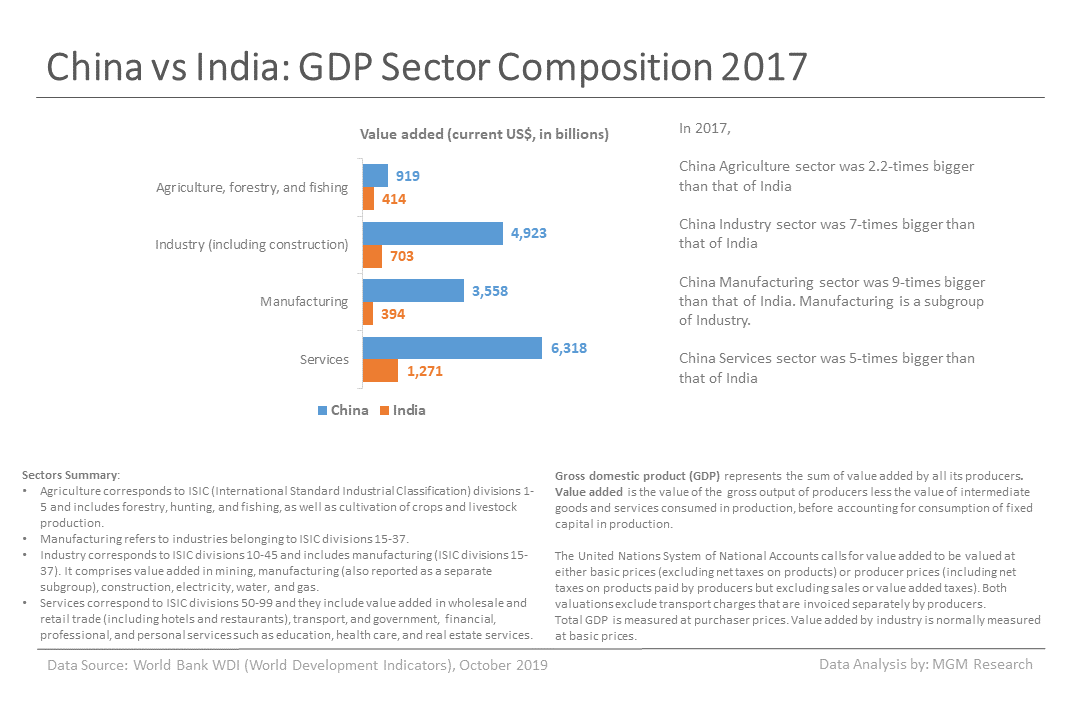
Let us now compare the size of the following sectors in China and India economies: Agriculture, Industry, Manufacturing, and Services.
China agriculture sector (includes forestry, hunting, and fishing, as well as cultivation of crops and livestock production) was 2.2-times bigger than India agriculture sector in 2017.
China industry sector (comprising of mining, manufacturing, construction, electricity, water, and gas) was 7-times bigger than India industry sector in 2017.
China manufacturing sector (a subgroup of the industry sector) was 9-times bigger than India manufacturing sector during 2017.
China services sector (comprising of wholesale and retail trade, hotels and restaurants, transport, and government, financial, professional, and personal services such as education, health care, and real estate services) was 5-times bigger than India services sector during 2017.
The following chart provides a size comparison of China and India key sectors.
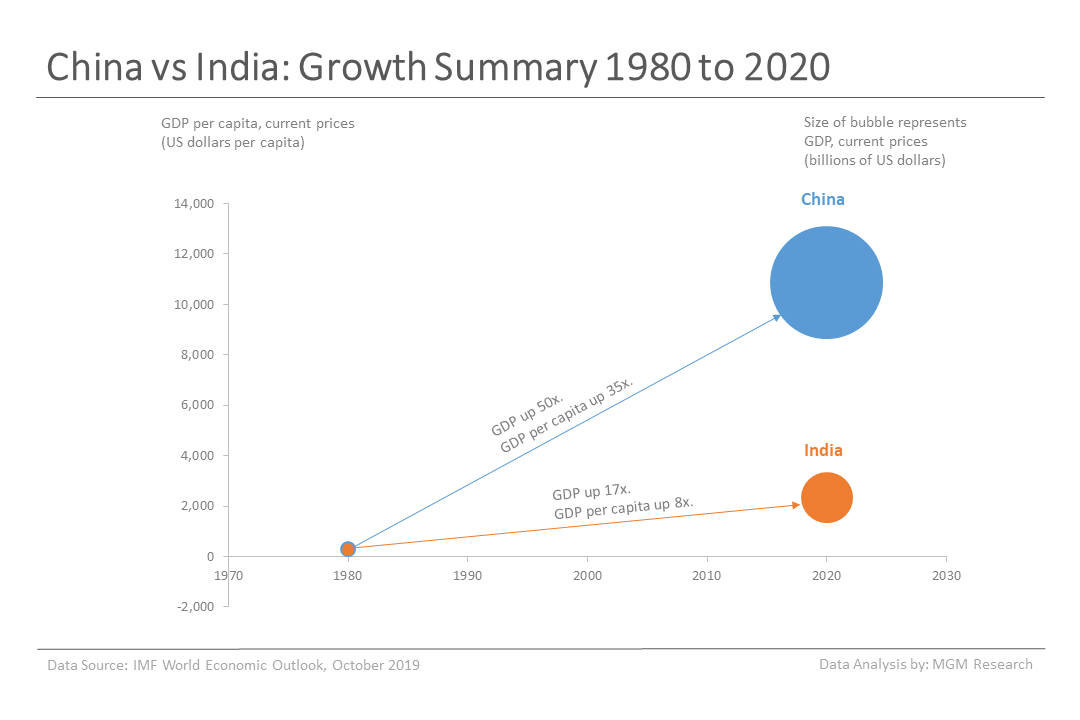
China vs India - GDP Indicators Growth Summary
The following chart shows the increase in GDP and GDP per capita of China and India from 1980 to 2020. China GDP in 2020 would be 50-times its GDP in 1980 and India GDP in 2020 would be 17-times its GDP in 1980. Clearly, China has grown much faster than India in GDP. China GDP per capita in 2020 would be 35-times its GDP per capita in 1980 and India GDP per capita in 2020 would be 8-times its GDP per capita in 1980. So, China has grown much faster than India in GDP per capita as well.
Related Articles
China GDP by presidents 1980-2020
India GDP by prime ministers 1980-2020
Is India GDP target of $5 trillion by 2024 achievable?